

 English
 Bahasa Melayu
 Bahasa Indonesia
 Tiếng Việt
 ไทย
ไทย
本翻譯僅作學術交流用,無商業意圖,請勿轉載,如有疑議問請來信
最新研究揭示,在糖尿病管理中,僅依賴糖化血紅蛋白A1C指標可能不足夠。專家提倡使用包括範圍內時間、低血糖事件以及其他葡萄糖指標的綜合評估方法。這種多維度評估能更準確反映病人的血糖控制情況,有助於定制更個性化的治療方案,從而提升患者結果和自我管理能力。

糖尿病管理中超越糖化血紅蛋白A1C的指標:範圍內時間、低血糖和其他參數
Metrics Beyond Hemoglobin A1C in Diabetes Management: Time in Range, Hypoglycemia, and Other Parameters
Wright LA, Hirsch IB. Metrics Beyond Hemoglobin A1C in Diabetes Management: Time in Range, Hypoglycemia, and Other Parameters. Diabetes Technol Ther. 2017 May;19(S2):S16-S26. doi: 10.1089/dia.2017.0029. PMID: 28541136; PMCID: PMC5444503.
https://www.ncbi.nlm.nih.gov/pmc/articles/PMC5444503/
Abstract
We review clinical instances in which A1C should not be used and reflect on the use of other glucose metrics that can be used, in substitution of or in combination with A1C and SMBG, to tailor an individualized approach that will result in better outcomes and patient empowerment.
Keywords: : Glucose metrics, Glycemic biomarkers, Continuous glucose monitoring, Flash-continuous glucose monitoring
摘要
我們回顧了不應使用糖化血紅蛋白A1C(A1C)的臨床實例,並反思了可以使用其他葡萄糖指標來替代或結合A1C和自我監測血糖(SMBG),以定制個性化方法,從而獲得更好的結果和患者賦權。
關鍵詞:葡萄糖指標,血糖生物標誌物,連續葡萄糖監測,快速連續葡萄糖監測
引言
頻繁評估和精確測量葡萄糖控制是最佳糖尿病(DM)護理的重要部分。由於第1型DM和第2型DM的干預研究將改善的葡萄糖控制與降低併發症風險相關聯,因此A1C以及自我監測血糖(SMBG)被認為是DM治療的黃金標準。1-3隨著評估血糖的新技術的出現,最近將低血糖與不良結果聯繫起來的證據,以及對A1C和SMBG限制的增加認識,需要納入新的指標,以更好地了解葡萄糖的動態特性,如何幫助患者實現最佳控制,減少併發症,並通過減少推薦的干預措施的負擔來提高患者滿意度。已提出多種A1C以外的葡萄糖控制參數,可能會為DM提供者帶來負擔。
血清生物標誌物
血糖生物標誌物是用來估計慢性糖尿病(DM)併發症風險的替代指標。它們用於確定患者的平均血糖控制是否在一定時期內維持在目標範圍內,這取決於所使用的生物標誌物。目前有四種臨床生物標誌物:A1C、糖化蛋白質:果糖胺(FA)和糖化白蛋白(GA),後者在美國尚無臨床可用,以及1,5-無水葡萄糖(1,5-AG)。
糖化血紅蛋白A1C
在正常血液學狀況和非懷孕人群中,A1C反映了過去8-12週的平均血糖水平。它的定期監測被廣泛使用,並被認為是評估DM控制的主要技術,與自我監測血糖(SMBG)並列。4
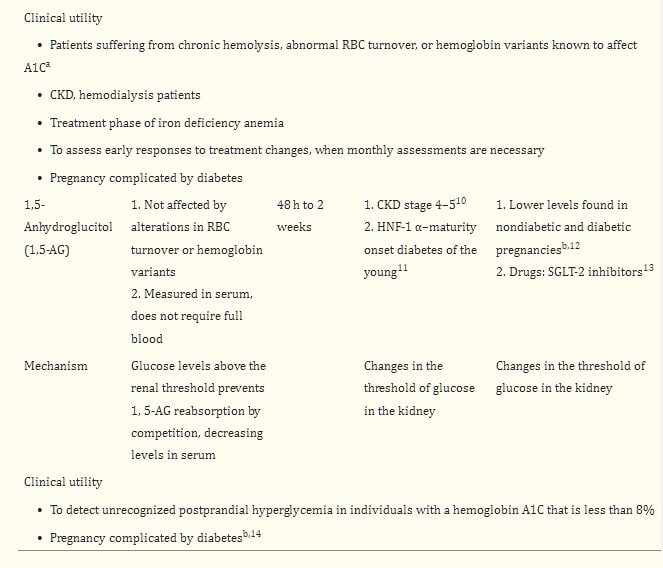
影響紅血球(RBC)壽命的狀況將影響其值,而與血糖無關。5 這種影響的程度目前無法測量,並且經常未被充分認識。表1總結了影響A1C和其他血清葡萄糖生物標誌物準確性的常見狀況。
表1血清血糖生物標誌物
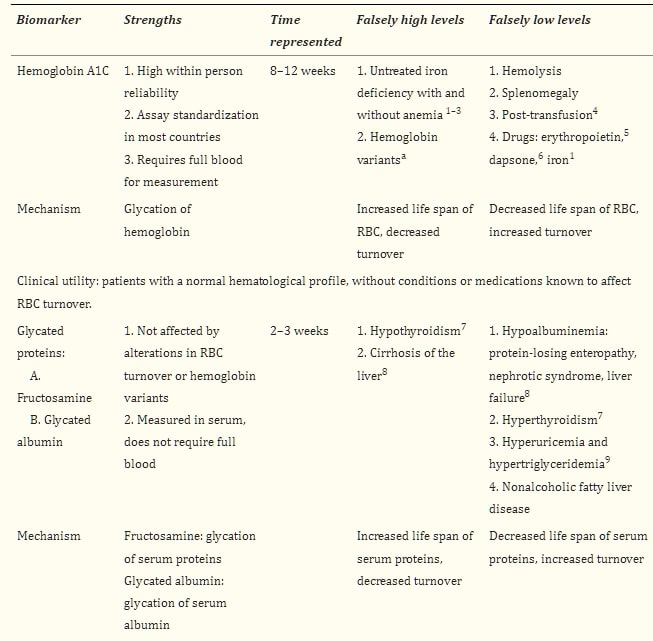
在少數族裔中,特別是非洲裔美國人(AA),在不同程度的葡萄糖耐受狀態下,且獨立於血糖水平,已描述出更高的A1C值。6-8 對葡萄糖的紅血球滲透性差異、A1C產生速率的酶活性等是一些提出的機制。9,10 不依賴紅血球壽命或細胞內葡萄糖滲透性的新生物標誌物的出現,使人們質疑A1C是否獨立於血糖在少數族裔中較高,這表明A1C中的這種“差異”可能並不總是獨立於葡萄糖。11 然而,在臨床實踐中,這些差異的病因經常仍然不甚了解(案例1)。
糖化蛋白質
除了血紅蛋白外,其他蛋白質也可以發生糖化。糖化蛋白質是血清蛋白質,當長期暴露於葡萄糖下會永久改變其組成,變成不可逆的酮胺。果糖胺(FA)指的是多種蛋白質,其中白蛋白佔約90%;糖化白蛋白(GA)專指白蛋白。12
糖化蛋白質與微血管13-15和大血管併發症16-21以及糖尿病患者的死亡率22有關。幾項前瞻性研究顯示了它們對於有風險發展微血管和大血管併發症的患者的實用性。13,23,24
FA和GA是細胞外蛋白質,提供了2-3週平均血糖水平的指標,即它們的平均半衰期,因此被提議為血糖控制的中期標誌。它們的糖化速率不受紅血球壽命的影響,因此在A1C可能不是可靠標誌的情況下使用,如在血液透析患者中,幾項研究顯示與A1C相比具有優勢25-27,且在這些患者中,升高的FA和GA是心血管(CV)事件、所有原因和CV死亡的風險因素,獨立於其他混淆變量。28 其他使用它們的情境包括評估對治療改變的較早反應或在糖尿病合並妊娠中。29
由於糖化速率取決於感興趣蛋白質的轉換率,任何影響其半衰期的狀況都將影響其值,獨立於血糖控制(表1)。
糖化蛋白質在肝硬化患者中相對於血漿葡萄糖水平呈現更高的值,這歸因於幾種機制:(1)血清白蛋白半衰期延長,源於體內白蛋白合成能力降低30;(2)肝硬化患者增加的免疫球蛋白產生,31(在肝硬化和肝炎患者中,球蛋白傾向於增加,這被認為是門脈靜脈血中細菌抗原分流到肝臟以外的淋巴組織,引發免疫球蛋白產生的次級反應)。32 然而,隨著肝硬化惡化,肝臟的合成功能下降,白蛋白水平下降,因此在肝衰竭中,隨著白蛋白降低,糖化蛋白質也會減少。糖化白蛋白(GA)相對於血漿葡萄糖水平在吸煙者33、高尿酸血症患者34、高三酸甘油酯血症35和非酒精性脂肪肝病(NAFLD)患者36中設定較低,後者可能是慢性微炎症的次級反應,在肥胖患者中,增加的白蛋白分解,縮短了白蛋白的半衰期,使糖化蛋白質相對於血漿葡萄糖水平下降。37
果糖胺(FA)濃度更可能受到血液中共存的蛋白質和低分子量物質(如膽紅素、尿酸)濃度的影響,31 而糖化白蛋白反映的是GA與總血清白蛋白的比例,以比例(%)表示,因此血清蛋白濃度的變化對糖化白蛋白的影響小於果糖胺。38,39
使用糖化蛋白質的一個重要限制是缺乏確立的臨床切點、標準化以及在臨床實踐中測量頻率的數據。已經進行了一些努力來估計類似於A1C水平的值,40-45但是,臨床目標仍然不明確。
葡萄糖作為主要的能量來源有許多重複的調節機制,其臨床解釋需要理解血糖是一個動態過程,這是所有糖化蛋白質(包括A1C)的真實限制。糖化蛋白質的值是“非動態的”,使其成為粗略的血糖測量手段。具有相似A1C的患者可能有非常不同的血糖模式、低血糖和高血糖的發生率,這些波動會根據其嚴重程度影響A1C,不幸的是,臨床上無法僅通過A1C或標誌物的值來識別,46因此自我監測血糖(SMBG)仍然是輔助任何可用的血清生物標誌物的工具。
糖化間隙假說:蛋白質的糖化是一個持續的動態過程,取決於許多因素,其中許多已被認識(表1),但其他因素理解不足,也許並不僅僅與平均血糖相關。糖化間隙(GG)是指A1C與血清果糖胺預測的A1C之間的差異。如果實際測得的A1C小於根據果糖胺預測的A1C,則GG為負;如果實際測得的A1C大於預測的A1C,則GG為正。當A1C和果糖胺一致時,GG為零。正GG已與第1型和第2型糖尿病(T2DM)中微血管併發症的風險相關聯。24,47相反,已在併發症風險較低的患者中描述了負GG。48
1,5-無水葡萄糖
1,5-AG是一種單醣,是葡萄糖的1-去氧形式。當血糖水平升高超過腎臟對葡萄糖的閾值時,它會阻止1,5-AG的再吸收,導致其排泄,從而降低血清水平。1,5-AG反映了過去48小時至2週的血糖控制,其濃度主要用於檢測飯後血糖(PPG),低水平是由於血糖峰值超過腎臟閾值,特別適用於A1C <8%的患者。49
發現1,5-AG與長期微血管結果風險負相關,14,50,51以及心血管疾病風險增加52-54和糖尿病死亡率。53
1,5-AG的濃度隨著妊娠進展在非糖尿病和糖尿病受試者中均會下降55;儘管如此,1,5-AG已被發現是妊娠合並糖尿病的有用標誌物,與T1D1女性的平均血糖、血糖波動性(GV)和血糖暴露相關,這些女性的血糖控制是通過連續葡萄糖監測(CGM)系統評估的。56 低水平與新生兒出生體重負相關。56-58
這種生物標誌物的限制主要來自腎功能和影響腎臟對葡萄糖閾值的因素。59 在嚴重高血糖和明顯糖尿症(A1C >10%)中尚未充分研究1,5-AG。60 目前還沒有關於在臨床實踐中應多久獲得此生物標誌物的指南(表1)。
自我監測血糖
自我監測血糖(SMBG)是患者用來評估所開處方的有效性和安全性的強大工具。對於大多數接受密集胰島素治療的糖尿病患者,建議在餐前、小吃、睡前、偶爾餐後、運動前、懷疑低血糖和低血糖矯正後以及駕駛等任務前進行SMBG。4 不出所料,SMBG的頻率與血糖控制的改善之間存在正相關。61
來自SMBG的指標
空腹血漿葡萄糖、飯後血糖推薦使用血清空腹血漿葡萄糖(FPG)和2小時飯後血糖(PPG)來診斷糖尿病。4 2小時PPG似乎診斷出更多的糖尿病患者,因為血糖控制的早期惡化特徵是PPG控制的喪失。62 FPG和PPG提供血糖值的“快照”,隨著A1C的增加,這些測量對A1C的相對貢獻。63,64 許多研究將PPG與心血管疾病和心血管事件聯繫起來,具有合理的病理生理學65-68,並報告針對PPG而不是FPG可以降低心血管風險,69 儘管其他人報告在針對PPG時心血管事件率無差異。70 PPG有助於評估餐後血糖波動和糖尿病治療的有效性。
糖尿病血糖風險評估方程式(GRADE)得分指的是與血糖曲線相關的風險程度。它是從SMBG獲得的,用於量化高血糖和低血糖,通過獲得在指定給定範圍內花費時間的百分比(%GRADE低血糖,%GRADE正常血糖,和%GRADE高血糖)。小於5的值對應於正常血糖。71
平均每日風險範圍(ADRR)是根據1個月的SMBG數據計算的,理想情況下每天進行三到五次讀數。血糖數據需要進行數學轉換,以給予高血糖和低血糖適當的權重,並轉換為相應的風險值。然後將它們實施在電子表格或軟件中,並基於ADRR的分佈,將值分層為風險類別:低風險<20;中等風險,20-40;和高風險,>40。72
在第1型糖尿病(T1DM)患者中,ADRR已顯示與胰島素敏感性正相關,與腎上腺素釋放負相關,推測較高的胰島素敏感性和低血糖期間較低的腎上腺素反應與較高的血糖波動性(GV)相關。73 它與A1C相關,與C肽水平負相關,表明β細胞功能減退與較高的GV相關。74 在成年第2型糖尿病(T2DM)患者中,來自CGM的ADRR得分與花費在目標血糖範圍以下的時間相關。75 數項研究發現,在使用實時CGM時,ADRR對治療變化相對不敏感。如Patton等人總結的,ADRR似乎是極端血糖值的良好標誌/預測指標,但對GV而言是保守的測量手段。76
連續葡萄糖監測
由技術進步驅動的劇變持續發生;反過來,更先進監測選項的結果增加了證據,表明糖尿病的慢性併發症不僅是慢性高血糖的結果,還包括血糖波動性(GV)和低血糖。連續葡萄糖監測(CGM)使人們明白,以往的定期指標不足以最佳管理糖尿病中的血糖。CGM克服了許多傳統指標所帶來的限制。
目前有幾種CGM系統可用,可分為回顧性、實時或閃爍監測系統。
專業回顧性CGM
專業回顧性CGM(PCGM)是指使用患者佩戴的皮下CGM,但直到提供者下載和審查數據之前,患者對結果是盲目的,目的是調整胰島素劑量或評估模式並提供教育以修改患者的行為。在門診設置中,它是識別模式和/或其他未被認識的血糖控制不良原因的工具;以及在個人CGM不是選項的患者中。
研究已經探討了PCGM對改善A1C的效用,結果存在爭議。在包括102名第1型和第2型糖尿病(T1和T2DM)患者的回顧性研究中,干預後7個月沒有報告A1C改善。77 其他研究報告了T1DM高血糖患者78以及T1和T2DM患者78,79的A1C改善,以及主要有低血糖症的T2DM患者78;在這項相同的研究中,被歸類為兩種DM的波動血糖水平的患者中,A1C沒有變化。79 PCGM後血糖控制的持久性顯示,PCGM後3-5個月的改善在1年後丟失。78 已觀察到自我報告的低血糖改善。78,79
對於這項技術的指徵,目前沒有隨機對照試驗或臨床指南。先前的回顧性研究已包括低血糖和高血糖79,以及GV78作為提供者向患者開處此技術的原因。我們的團隊在學術環境中確定GV和高血糖是預訂PCGM的最常見原因,並描述了在SMBG頻率或平均血糖沒有顯著變化的情況下A1C的改善,以及PCGM後自我報告的低血糖沒有差異。不出所料,在進行更頻繁SMBG的患者中,A1C的變化更為顯著。80
個人CGM
與靜態圖像(每天六到八次血糖測量)相比,這種監測工具的實時性質使患者能夠在血糖值迅速變化時進行干預,從而預防血糖波動和暴露於高血糖和/或低血糖。個人CGM允許對完整曲線進行回顧性分析,由患者在家中和/或提供者在診所或遠程進行,促進針對糖尿病的個性化方法。
已經證明使用CGM可改善血糖控制、低血糖發生率和患者滿意度;儘管有這些優勢,CGM仍然被低估使用。設備和供應品的成本、缺乏或有限的保險,以及患者和提供者的看法都發揮了作用。
臨床醫生對此技術的不熟悉在整個過程的幾個階段都構成了障礙:對CGM候選人的了解有限、技術、診所所需軟件以及下載、解釋、為患者提供教育和反饋的時間都有限。
在2013年,發表了《標準化葡萄糖報告與分析以優化糖尿病臨床決策建議:門診葡萄糖概況(AGP)》;在認識到CGM的廣泛應用受到接受評估和報告葡萄糖概況/數據措施缺乏的阻礙,這可能導致臨床醫生不願將此工具納入臨床實踐。81
源自CGM的指標 AGP確定的關鍵指標包括目標範圍、葡萄糖暴露、GV、低血糖和高血糖。目標範圍和範圍內時間 目標範圍和範圍內時間可以表達為“葡萄糖讀數的%”或“每天小時數”。建議的目標範圍為70-180毫克/分升,被認為適合臨床實踐,因為已觀察到如果50%的SMBG讀數在此範圍內,A1C約為7%。82
葡萄糖暴露 葡萄糖暴露指的是平均或平均葡萄糖,這是臨床醫生和患者熟悉的指標。在CGM期間特定時間段(例如,夜間、空腹、飯後2-4小時)的平均葡萄糖暴露對評估食物、運動或胰島素的效果很有幫助,並且易於在臨床實踐中實施。
葡萄糖變異指數 (GV) 數十年來一直是糖尿病(DM)臨床醫生和研究人員感興趣的主題。許多研究強烈表明,GV(即圍繞平均值的急性葡萄糖波動,包括高血糖波動以及低血糖暴露)可能是微血管並發症的重要風險因素,且可能有助於解釋為什麼有些病人發展微血管並發症而其他A1C相同的病人卻沒有。
糖尿病併發症與控制試驗(DCCT)的發現,即接受強化和常規治療的相同A1C水平病人在微血管並發症的發生率不同83,強烈刺激了糖尿病科學界深入探討除A1C之外的其他血糖風險因素,即GV,作為DM併發症的貢獻因素。然而,該主題仍存在爭議,但普遍接受GV是低血糖的強烈預測因子,84-86導致血糖控制不良,進而導致病人滿意度低,可能增加DM負擔風險和不良遵從性。為了達到血糖穩定並降低低血糖風險,最小化GV是必要的。87,88
為了標準化血糖測量並方便使用,熟悉度和與其他血糖控制因素的相關性,提出了三種GV的測量方法:平均血糖周圍的標準差(SD)、變異系數(CV)和四分位數範圍(IQR)。81
平均血糖周圍的標準差 用於評估和報告GV最常用和理解的指標是SD。血糖的SD是周圍神經病變的盛行率的預測因子89,並與T1DM中的微血管併發症90和亞臨床動脈粥樣硬化有關。91
對接受胰島素治療的T1和T2DM患者,在使用CGM期間的一週內對30項血糖控制和變異性質量的分析得出結論,大多數GV指標與整體SD高度相關,87在一定程度上證實了其臨床使用的有效性。對SD的批評來自於血糖數據通常不是圍繞平均值正常分布,以及SD的可靠性受數據分布的影響;因此,已經開發了使用公式或方程式的指數,72,92然而,在繁忙的臨床設置中實施不切實際。
已經提出了一個平均血糖與SD的比率,其中3被認為是良好的,2被認為是差的。93 Rodbard等人的研究結果與這個簡便實用的計算一致。87這個簡單的公式已經成為我們診所的標準,僅當平均值在120至180毫克/分升之間。以3的比率和平均血糖<120毫克/分升,存在過多的低血糖,而嚴重的平均高血糖則顯然整體控制不良。87
變異系數 派生自SD(觀測值平均值的100×SD)。無論A1C或平均血糖水平如何,其百分位數的相對恆定性,防止了SD和其他平均血糖值指標的強依賴性,使CV成為一個良好的GV參數。作為研究目的的良好指標,然而,不易顯示,因此作為CGM臨床視圖的一部分較不有幫助。
如果平均血糖低且標準差大,因此%CV也大,則低血糖的風險將會高。相反,如果平均值和SD都高,但%CV低,則低血糖的風險相對較低。同樣地,對於高血糖的風險,高平均值會產生高頻率的高血糖,這相對不受SD大小的影響。如果SD大,低平均值可能產生高血糖風險,但如果SD小則不會。
%CV與低血糖風險的相關性已被觀察到,85增強了其作為GV參數的實用性。94 人們希望%CV,作為臨床研究中GV測量的標準,將來能夠用於臨床使用。
四分位範圍IQR計算葡萄糖值的第75和第25百分位之間的差異,且50%的葡萄糖值是IQR。它的優點是易於識別,並不依賴於正常分布的假設。它允許容易地看到一天中或與餐飲或藥物相關的高GV時間,這可能需要臨床關注。95,96
低血糖 低血糖是糖尿病(DM)患者的主要障礙,也是實現良好血糖平衡的限制因素。97研究已將低血糖與過度的發病率和死亡率聯繫起來。98-100 鑒於減少低血糖的重要性,已努力達成關於其發生頻率和嚴重程度的共識。101 門診葡萄糖概況(AGP)對CGM用戶報告低血糖的共識將其分類為對應於血糖水平:如果血糖<70毫克/分升則為低;<60毫克/分升則非常低,<50毫克/分升則極度危險。建議報告這些閾值以下的血糖百分比和每個範圍內的時間,以及每個範圍的事件次數(定義為連續10分鐘以下的標準)。美國糖尿病協會(ADA)和歐洲糖尿病研究協會聯合聲明建議在臨床試驗中報告低血糖時使用以下血糖水平:第1級:血糖警示值70毫克/分升或以下;第2級:血糖水平<54毫克/分升,足夠低以指示嚴重、臨床上重要的低血糖,第3級:嚴重認知障礙,需要外部協助恢復。4,102
高血糖 建議血糖目標上限180毫克/分升以上的嚴重程度如下:高>180毫克/分升;非常高>250毫克/分升,極度危險>400毫克/分升。與低血糖一樣,建議一個臨床基礎的嚴重高血糖類別,即糖尿病酮症酸中毒,以促進患者和臨床團隊的監控(即,排除泵療法的技術問題,補充水分,以及更頻繁的胰島素糾正),以防止酮體血症和住院治療的升級。
閃爍葡萄糖感測技術
閃爍連續葡萄糖監測(FCGM)系統技術是一種工廠校準的間質葡萄糖監測系統,目前以專業的、對患者隱藏的選項(FreeStyle® Libre™ Pro)提供,也作為用於替代SMBG的個人監測系統。FCGM使用一種在電化學傳感器上共固定的有線葡萄糖氧化酶酵素,佩戴在手臂背面長達14天。個人FCGM目前在美國尚未上市。患者可以通過掃描傳感器以讀取器獲得實時讀數,頻率高達每分鐘一次。數據從傳感器自動傳輸至讀取器記憶體,每15分鐘自動存儲一次,允許在螢幕上顯示前8小時的趨勢、血糖變化率和方向。FCGM沒有警報功能。數據可上傳以獲得摘要報告,供個人審查或在臨床上由DM提供者審查。
FCGM準確性高,報告的整體平均絕對相對差異(MARD)為11.4%,與毛細血管BG參考值相比,在14天使用期間穩定,且不受體重指數、年齡、糖尿病類型、臨床地點、胰島素管理或A1C的影響。103 FCGM的使用已與無控制的T2和T1DM患者血糖控制的改善相關聯,並在使用該裝置長達24週後仍維持此效果。104 在血糖控制良好的T1DM患者中,使用FCGM在6個月時(干預組)與對照組(SMBG)相比,減少了38%的低血糖時間。105 FCGM減少低血糖的好處隨後在接受胰島素治療的T1和T2DM患者中得到了復制。在65歲以下的T2DM患者中,與SMBG組相比,FCGM降低了A1C,同時在<70毫克/分升、<55毫克/分升和<45毫克/分升的範圍內分別減少了43%、53%和64%的低血糖時間。夜間和白天的低血糖分別減少了54%和31%。有趣的是,在這項研究中,在224名隨機參與者中,對於65歲以上的患者,與對照組(SMBG)相比,FCGM並未降低A1C,但在FCGM使用者中,低血糖時間減少了56%。106
一項直接的CGM(Dexcom G4 Platinum)與FCGM的比較顯示,針對T1DM的門診患者,兩種傳感器在長達14天內的葡萄糖概況和MARD相似,且在臨床診斷參數的估計中未檢測到顯著差異。107 FCGM與治療滿意度和生活質量指標呈正相關。105,106,108
圖1為FCGM如何影響DM治療提供了一個很好的例子。在一位60歲的AA族裔女性患者中,她患有T2DM,正在服用二甲雙胍和磺脲類藥物,A1C為8.1%,每天測試2次,其平均血糖為132毫克/分升。這引起了對A1C比SMBG預測的更高值的質疑。FCGM顯示平均血糖為143毫克/分升,估算的A1C為6.6%。這種程度的差異在AA族裔中並不罕見,FCGM證實了她的血糖和A1C之間的差異。
圖1
一位60歲非裔美國女性使用FCGM,其A1C錯誤地升高至8.1%。
參考文獻
A1C繼續是評估糖尿病患者血糖控制的黃金標準,然而,在臨床實踐中,已經明顯地存在許多情況,A1C無法真實反映平均血糖,因為其準確性受到影響紅血球存活率變化和/或由於GG。目前,所有目前可用的血糖生物標誌物都有優勢和限制,哪個標誌物或它們的組合可能與不同人群患者的並發症有最佳關聯尚不清楚。對於個別患者,我們的所有生物標誌物,包括A1C,都只能粗略評估血糖控制。
管理糖尿病患者的臨床醫生應熟悉更廣泛的最佳血糖控制定義,不僅包括A1C(當準確時),還包括其他指標的組合,這些指標更真實地反映血糖控制的動態特性,考慮到檢查期間,選擇的每個指標的限制,共病,藥物(胰島素、口服降糖藥),以及推薦干預的可行性和負擔(SMBG、CGM、FCGM)。
認識到糖尿病中血糖控制與行為的相互作用,個人CGM和FCGM成為記錄和干預血糖失調框架內許多組成部分的選項,不僅反映平均血糖或A1C,還包括波動及其潛在的短期和長期風險。個人CGM現在是許多患者更好地記錄是否真的存在GG的另一個選擇,即使沒有,也可以做出更有信息性的決策。以標準化方式報告的CGM有潛力幫助臨床醫生賦予患者力量,減輕與糖尿病及其並發症共存的負擔。
連續葡萄糖監測
1. The effect of intensive treatment of diabetes on the development and progression of long-term complications in insulin-dependent diabetes mellitus. The Diabetes Control and Complications Trial Research Group. N Engl J Med 1993;329:977–986 [PubMed] [Google Scholar]
2. Intensive blood-glucose control with sulphonylureas or insulin compared with conventional treatment and risk of complications in patients with type 2 diabetes (UKPDS 33). UK Prospective Diabetes Study (UKPDS) Group. Lancet 1998;352:837–853 [PubMed] [Google Scholar]
3. Effect of intensive blood-glucose control with metformin on complications in overweight patients with type 2 diabetes (UKPDS 34). UK Prospective Diabetes Study (UKPDS) Group. Lancet 1998;352:854–865 [PubMed] [Google Scholar]
4. Standards of Medical Care in Diabetes-2017: Summary of revisions. Diabetes Care 2017;40(Suppl 1):S4–S5 [PubMed] [Google Scholar]
5. Sacks DB: Hemoglobin A1c in diabetes: panacea or pointless? Diabetes 2013;62:41–43 [PMC free article] [PubMed] [Google Scholar]
6. Herman WH, Ma Y, Uwaifo G, et al.: Differences in A1C by race and ethnicity among patients with impaired glucose tolerance in the Diabetes Prevention Program. Diabetes Care 2007;30:2453–2457 [PMC free article] [PubMed] [Google Scholar]
7. Saydah S, Cowie C, Eberhardt MS, et al.: Race and ethnic differences in glycemic control among adults with diagnosed diabetes in the United States. Ethn Dis 2007;17:529–535 [PubMed] [Google Scholar]
8. Herman WH, Dungan KM, Wolffenbuttel BH, et al.: Racial and ethnic differences in mean plasma glucose, hemoglobin A1c, and 1,5-anhydroglucitol in over 2000 patients with type 2 diabetes. J Clin Endocrinol Metab 2009;94:1689–1694 [PubMed] [Google Scholar]
9. Yudkin JS, Forrest RD, Jackson CA, et al.: Unexplained variability of glycated haemoglobin in non-diabetic subjects not related to glycaemia. Diabetologia 1990;33:208–215 [PubMed] [Google Scholar]
10. Khera PK, Joiner CH, Carruthers A, et al.: Evidence for interindividual heterogeneity in the glucose gradient across the human red blood cell membrane and its relationship to hemoglobin glycation. Diabetes 2008;57:2445–2452 [PMC free article] [PubMed] [Google Scholar]
11. Selvin E, Francis LM, Ballantyne CM, et al.: Nontraditional markers of glycemia: associations with microvascular conditions. Diabetes Care 2011;34:960–967 [PMC free article] [PubMed] [Google Scholar]
12. Armbruster DA: Fructosamine: structure, analysis, and clinical usefulness. Clin Chem 1987;33:2153–2163 [PubMed] [Google Scholar]
13. Selvin E, Rawlings AM, Grams M, et al.: Fructosamine and glycated albumin for risk stratification and prediction of incident diabetes and microvascular complications: a prospective cohort analysis of the Atherosclerosis Risk in Communities (ARIC) study. Lancet Diabetes Endocrinol 2014;2:279–288 [PMC free article] [PubMed] [Google Scholar]
14. Mukai N, Yasuda M, Ninomiya T, et al.: Thresholds of various glycemic measures for diagnosing diabetes based on prevalence of retinopathy in community-dwelling Japanese subjects: the Hisayama Study. Cardiovasc Diabetol 2014;13:45. [PMC free article] [PubMed] [Google Scholar]
15. Kondaveeti SB, Kumaraswamy D, Mishra S, Kumar A, Shaker IA: Evaluation of glycated albumin and microalbuminuria as early risk markers of nephropathy in type 2 diabetes mellitus. J Clin Diagn Res 2013;7:1280–1283 [PMC free article] [PubMed] [Google Scholar]
16. Furusyo N, Koga T, Ai M, et al.: Plasma glycated albumin level and atherosclerosis: results from the Kyushu and Okinawa Population Study (KOPS). Int J Cardiol 2013;167:2066–2072 [PubMed] [Google Scholar]
17. Lu L, Pu LJ, Xu XW, et al.: Association of serum levels of glycated albumin, C-reactive protein and tumor necrosis factor-alpha with the severity of coronary artery disease and renal impairment in patients with type 2 diabetes mellitus. Clin Biochem 2007;40:810–816 [PubMed] [Google Scholar]
18. Jin C, Lu L, Zhang RY, et al.: Association of serum glycated albumin, C-reactive protein and ICAM-1 levels with diffuse coronary artery disease in patients with type 2 diabetes mellitus. Clin Chim Acta 2009;408:45–49 [PubMed] [Google Scholar]
19. Lu L, Pu LJ, Zhang Q, et al.: Increased glycated albumin and decreased esRAGE levels are related to angiographic severity and extent of coronary artery disease in patients with type 2 diabetes. Atherosclerosis 2009;206:540–545 [PubMed] [Google Scholar]
20. Song SO, Kim KJ, Lee BW, et al.: Serum glycated albumin predicts the progression of carotid arterial atherosclerosis. Atherosclerosis 2012;225:450–455 [PubMed] [Google Scholar]
21. Shen Y, Pu LJ, Lu L, et al.: Glycated albumin is superior to hemoglobin A1c for evaluating the presence and severity of coronary artery disease in type 2 diabetic patients. Cardiology 2012;123:84–90 [PubMed] [Google Scholar]
22. Selvin E, Rawlings AM, Lutsey PL, et al.: Fructosamine and glycated albumin and the risk of cardiovascular outcomes and death. Circulation 2015;132:269–277 [PMC free article] [PubMed] [Google Scholar]
23. Nathan DM, McGee P, Steffes MW, Lachin JM: Relationship of glycated albumin to blood glucose and HbA1c values and to retinopathy, nephropathy, and cardiovascular outcomes in the DCCT/EDIC study. Diabetes 2014;63:282–290 [PMC free article] [PubMed] [Google Scholar]
24. Cohen RM, LeCaire TJ, Lindsell CJ, et al.: Relationship of prospective GHb to glycated serum proteins in incident diabetic retinopathy: implications of the glycation gap for mechanism of risk prediction. Diabetes Care 2008;31:151–153 [PubMed] [Google Scholar]
25. Inaba M, Okuno S, Kumeda Y, et al.: Glycated albumin is a better glycemic indicator than glycated hemoglobin values in hemodialysis patients with diabetes: effect of anemia and erythropoietin injection. J Am Soc Nephrol 2007;18:896–903 [PubMed] [Google Scholar]
26. Vos FE, Schollum JB, Coulter CV, et al.: Assessment of markers of glycaemic control in diabetic patients with chronic kidney disease using continuous glucose monitoring. Nephrology (Carlton) 2012;17:182–188 [PubMed] [Google Scholar]
27. Freedman BI, Shihabi ZK, Andries L, et al.: Relationship between assays of glycemia in diabetic subjects with advanced chronic kidney disease. Am J Nephrol 2010;31:375–379 [PubMed] [Google Scholar]
28. Shafi T, Sozio SM, Plantinga LC, et al.: Serum fructosamine and glycated albumin and risk of mortality and clinical outcomes in hemodialysis patients. Diabetes Care 2013;36:1522–1533 [PMC free article] [PubMed] [Google Scholar]
29. Hashimoto K, Noguchi S, Morimoto Y, et al.: A1C but not serum glycated albumin is elevated in late pregnancy owing to iron deficiency. Diabetes Care 2008;31:1945–1948 [PMC free article] [PubMed] [Google Scholar]
30. Trenti T, Cristani A, Cioni G, et al.: Fructosamine and glycated hemoglobin as indices of glycemic control in patients with liver cirrhosis. Ric Clin Lab 1990;20:261–267 [PubMed] [Google Scholar]
31. Constanti C, Simo JM, Joven J, Camps J: Serum fructosamine concentration in patients with nephrotic syndrome and with cirrhosis of the liver: the influence of hypoalbuminaemia and hypergammaglobulinaemia. Ann Clin Biochem 1992;29 (Pt 4):437–442 [PubMed] [Google Scholar]
32. Triger DR, Wright R: Hyperglobulinaemia in liver disease. Lancet 1973;1:1494–1496 [PubMed] [Google Scholar]
33. Koga M, Saito H, Mukai M, et al.: Serum glycated albumin levels are influenced by smoking status, independent of plasma glucose levels. Acta Diabetol 2009;46:141–144 [PubMed] [Google Scholar]
34. Koga M, Murai J, Saito H, et al.: Serum glycated albumin, but not glycated haemoglobin, is low in relation to glycemia in hyperuricemic men. Acta Diabetol 2010;47:173–177 [PubMed] [Google Scholar]
35. Koga M, Murai J, Saito H, et al.: Serum glycated albumin, but not glycated hemoglobin, is low in relation to glycemia in men with hypertriglyceridemia. J Diabetes Investig 2010;1:202–207 [PMC free article] [PubMed] [Google Scholar]
36. Koga M, Murai J, Saito H, et al.: Serum glycated albumin levels, but not glycated hemoglobin, is low in relation to glycemia in non-diabetic men with nonalcoholic fatty liver disease with high alanine aminotransferase levels. Clin Biochem 2010;43:1023–1025 [PubMed] [Google Scholar]
37. Koga M, Otsuki M, Matsumoto S, et al.: Negative association of obesity and its related chronic inflammation with serum glycated albumin but not glycated hemoglobin levels. Clin Chim Acta 2007;378:48–52 [PubMed] [Google Scholar]
38. Kohzuma T, Yamamoto T, Uematsu Y, et al.: Basic performance of an enzymatic method for glycated albumin and reference range determination. J Diabetes Sci Technol 2011;5:1455–1462 [PMC free article] [PubMed] [Google Scholar]
39. Kohzuma T, Koga M: Lucica GA-L glycated albumin assay kit: a new diagnostic test for diabetes mellitus. Mol Diagn Ther 2010;14:49–51 [PubMed] [Google Scholar]
40. Juraschek SP, Steffes MW, Selvin E: Associations of alternative markers of glycemia with hemoglobin A(1c) and fasting glucose. Clin Chem 2012;58:1648–1655 [PMC free article] [PubMed] [Google Scholar]
41. Jung CH, Hwang YC, Kim KJ, et al.: Development of an HbA1c-based conversion equation for estimating glycated albumin in a Korean population with a wide range of glucose intolerance. PLoS One 2014;9:e95729. [PMC free article] [PubMed] [Google Scholar]
42. Inoue K, Tsujimoto T, Yamamoto-Honda R, et al.: A newer conversion equation for the correlation between HbA1c and glycated albumin. Endocr J 2014;61:553–560 [PubMed] [Google Scholar]
43. Tahara Y: Analysis of the method for conversion between levels of HbA1c and glycated albumin by linear regression analysis using a measurement error model. Diabetes Res Clin Pract 2009;84:224–229 [PubMed] [Google Scholar]
44. Van Dieijen-Visser MP, Seynaeve C, Brombacher PJ: Influence of variations in albumin or total-protein concentration on serum fructosamine concentration. Clin Chem 1986;32:1610. [PubMed] [Google Scholar]
45. Howey JE, Browning MC, Fraser CG: Assay of serum fructosamine that minimizes standardization and matrix problems: use to assess components of biological variation. Clin Chem 1987;33(2 Pt 1):269–272 [PubMed] [Google Scholar]
46. Kuenen JC, Borg R, Kuik DJ, et al.: Does glucose variability influence the relationship between mean plasma glucose and HbA1c levels in type 1 and type 2 diabetic patients? Diabetes Care 2011;34:1843–1847 [PMC free article] [PubMed] [Google Scholar]
47. Rodriguez-Segade S, Rodriguez J, Cabezas-Agricola JM, et al.: Progression of nephropathy in type 2 diabetes: the glycation gap is a significant predictor after adjustment for glycohemoglobin (Hb A1c). Clin Chem 2011;57:264–271 [PubMed] [Google Scholar]
48. Cohen RM, Holmes YR, Chenier TC, Joiner CH: Discordance between HbA1c and fructosamine: evidence for a glycosylation gap and its relation to diabetic nephropathy. Diabetes Care 2003;26:163–167 [PubMed] [Google Scholar]
49. Buse JB, Freeman JL, Edelman SV, et al.: Serum 1,5-anhydroglucitol (GlycoMark): a short-term glycemic marker. Diabetes Technol Ther 2003;5:355–363 [PubMed] [Google Scholar]
50. Kim WJ, Park CY, Park SE, et al.: Serum 1,5-anhydroglucitol is associated with diabetic retinopathy in Type 2 diabetes. Diabet Med 2012;29:1184–1190 [PubMed] [Google Scholar]
51. Selvin E, Rawlings AM, Grams M, et al.: Association of 1,5-anhydroglucitol with diabetes and microvascular conditions. Clin Chem 2014;60:1409–1418 [PMC free article] [PubMed] [Google Scholar]
52. Takahashi S, Shimada K, Miyauchi K, et al.: Low and exacerbated levels of 1,5-anhydroglucitol are associated with cardiovascular events in patients after first-time elective percutaneous coronary intervention. Cardiovasc Diabetol 2016;15:145. [PMC free article] [PubMed] [Google Scholar]
53. Selvin E, Rawlings A, Lutsey P, et al.: Association of 1,5-anhydroglucitol with cardiovascular disease and mortality. Diabetes 2016;65:201–208 [PMC free article] [PubMed] [Google Scholar]
54. Fujiwara T, Yoshida M, Yamada H, et al.: Lower 1,5-anhydroglucitol is associated with denovo coronary artery disease in patients at high cardiovascular risk. Heart Vessels 2015;30:469–476 [PubMed] [Google Scholar]
55. Tetsuo M, Hamada T, Yoshimatsu K, et al.: Serum levels of 1,5-anhydro-D-glucitol during the normal and diabetic pregnancy and puerperium. Acta Obstet Gynecol Scand 1990;69:479–485 [PubMed] [Google Scholar]
56. Nowak N, Skupien J, Cyganek K, et al.: 1,5-Anhydroglucitol as a marker of maternal glycaemic control and predictor of neonatal birthweight in pregnancies complicated by type 1 diabetes mellitus. Diabetologia 2013;56:709–713 [PMC free article] [PubMed] [Google Scholar]
57. Wright LA, Hirsch IB, Gooley TA, Brown Z: 1,5-anhydroglucitol and neonatal complications in pregnancy complicated by diabetes. Endocr Pract 2015;21:725–733 [PubMed] [Google Scholar]
58. Delaney SS, Coley RY, Brown Z: 1,5-Anhydroglucitol: a new predictor of neonatal birth weight in diabetic pregnancies. Eur J Obstet Gynecol Reprod Biol 2015;189:55–58 [PubMed] [Google Scholar]
59. Balis DA, Tong C, Meininger G: Effect of canagliflozin, a sodium-glucose cotransporter 2 inhibitor, on measurement of serum 1,5-anhydroglucitol. J Diabetes 2014;6:378–380 [PubMed] [Google Scholar]
60. Pal A, Farmer AJ, Dudley C, et al.: Evaluation of serum 1,5 anhydroglucitol levels as a clinical test to differentiate subtypes of diabetes. Diabetes Care 2010;33:252–257 [PMC free article] [PubMed] [Google Scholar]
61. Miller KM, Beck RW, Bergenstal RM, et al.: Evidence of a strong association between frequency of self-monitoring of blood glucose and hemoglobin A1c levels in T1D exchange clinic registry participants. Diabetes Care 2013;36:2009–2014 [PMC free article] [PubMed] [Google Scholar]
62. Monnier L, Colette C, Dunseath GJ, Owens DR: The loss of postprandial glycemic control precedes stepwise deterioration of fasting with worsening diabetes. Diabetes Care 2007;30:263–269 [PubMed] [Google Scholar]
63. Monnier L, Lapinski H, Colette C: Contributions of fasting and postprandial plasma glucose increments to the overall diurnal hyperglycemia of type 2 diabetic patients: variations with increasing levels of HbA(1c). Diabetes Care 2003;26:881–885 [PubMed] [Google Scholar]
64. Riddle M, Umpierrez G, DiGenio A, et al.: Contributions of basal and postprandial hyperglycemia over a wide range of A1C levels before and after treatment intensification in type 2 diabetes. Diabetes Care 2011;34:2508–2514 [PMC free article] [PubMed] [Google Scholar]
65. Standl E, Schnell O, Ceriello A: Postprandial hyperglycemia and glycemic variability: should we care? Diabetes Care 2011;34 Suppl 2:S120–S127 [PMC free article] [PubMed] [Google Scholar]
66. Hanefeld M, Fischer S, Julius U, et al.: Risk factors for myocardial infarction and death in newly detected NIDDM: the Diabetes Intervention Study, 11-year follow-up. Diabetologia 1996;39:1577–1583 [PubMed] [Google Scholar]
67. Cavalot F, Pagliarino A, Valle M, et al.: Postprandial blood glucose predicts cardiovascular events and all-cause mortality in type 2 diabetes in a 14-year follow-up: lessons from the San Luigi Gonzaga Diabetes Study. Diabetes Care 2011;34:2237–2243 [PMC free article] [PubMed] [Google Scholar]
68. Ceriello A: Postprandial hyperglycemia and cardiovascular disease: is the HEART2D study the answer? Diabetes Care 2009;32:521–522 [PMC free article] [PubMed] [Google Scholar]
69. Raz I, Ceriello A, Wilson PW, et al.: Post hoc subgroup analysis of the HEART2D trial demonstrates lower cardiovascular risk in older patients targeting postprandial versus fasting/premeal glycemia. Diabetes Care 2011;34:1511–1513 [PMC free article] [PubMed] [Google Scholar]
70. Raz I, Wilson PW, Strojek K, et al.: Effects of prandial versus fasting glycemia on cardiovascular outcomes in type 2 diabetes: the HEART2D trial. Diabetes Care 2009;32:381–386 [PMC free article] [PubMed] [Google Scholar]
71. Hill NR, Hindmarsh PC, Stevens RJ, et al.: A method for assessing quality of control from glucose profiles. Diabet Med 2007;24:753–758 [PubMed] [Google Scholar]
72. Kovatchev BP, Otto E, Cox D, et al.: Evaluation of a new measure of blood glucose variability in diabetes. Diabetes Care 2006;29:2433–2438 [PubMed] [Google Scholar]
73. Pitsillides AN, Anderson SM, Kovatchev B: Hypoglycemia risk and glucose variability indices derived from routine self-monitoring of blood glucose are related to laboratory measures of insulin sensitivity and epinephrine counterregulation. Diabetes Technol Ther 2011;13:11–17 [PMC free article] [PubMed] [Google Scholar]
74. Kim SK, Kwon SB, Yoon KH, et al.: Assessment of glycemic lability and severity of hypoglycemia in Korean patients with type 1 diabetes. Endocr J 2011;58:433–440 [PubMed] [Google Scholar]
75. Kohnert KD, Vogt L, Augstein P, et al.: Relationships between glucose variability and conventional measures of glycemic control in continuously monitored patients with type 2 diabetes. Horm Metab Res 2009;41:137–141 [PubMed] [Google Scholar]
76. Patton SR, Clements MA: Average daily risk range as a measure for clinical research and routine care. J Diabetes Sci Technol 2013;7:1370–1375 [PMC free article] [PubMed] [Google Scholar]
77. Pepper GM, Steinsapir J, Reynolds K: Effect of short-term iPRO continuous glucose monitoring on hemoglobin A1c levels in clinical practice. Diabetes Technol Ther 2012;14:654–657 [PubMed] [Google Scholar]
78. Patrascioiu I, Quiros C, Rios P, et al.: Transitory beneficial effects of professional continuous glucose monitoring on the metabolic control of patients with type 1 diabetes. Diabetes Technol Ther 2014;16:219–223 [PubMed] [Google Scholar]
79. Leinung M, Nardacci E, Patel N, et al.: Benefits of short-term professional continuous glucose monitoring in clinical practice. Diabetes Technol Ther 2013;15:744–747 [PubMed] [Google Scholar]
80. Wright L, Vasudevan S, Huynh P, et al.. Professional continuous glucose monitoring improves hemoglobin a1c in insulin-requiring diabetic patients. Endocr Rev 2014;35:MON-1004. http://press.endocrine.org/doi/abs/10.1210/endo-meetings.2014.DGM.3.MON-1004 (accessed May7, 2017)
81. Bergenstal RM, Ahmann AJ, Bailey T, et al.: Recommendations for standardizing glucose reporting and analysis to optimize clinical decision making in diabetes: the Ambulatory Glucose Profile (AGP). Diabetes Technol Ther 2013;15:198–211 [PubMed] [Google Scholar]
82. Brewer KW, Chase HP, Owen S, Garg SK: Slicing the pie. Correlating HbA—values with average blood glucose values in a pie chart form. Diabetes Care 1998;21:209–212 [PubMed] [Google Scholar]
83. The relationship of glycemic exposure (HbA1c) to the risk of development and progression of retinopathy in the diabetes control and complications trial. Diabetes 1995;44:968–983 [PubMed] [Google Scholar]
84. Qu Y, Jacober SJ, Zhang Q, et al.: Rate of hypoglycemia in insulin-treated patients with type 2 diabetes can be predicted from glycemic variability data. Diabetes Technol Ther 2012;14:1008–1012 [PubMed] [Google Scholar]
85. Monnier L, Wojtusciszyn A, Colette C, Owens D: The contribution of glucose variability to asymptomatic hypoglycemia in persons with type 2 diabetes. Diabetes Technol Ther 2011;13:813–818 [PubMed] [Google Scholar]
86. Kovatchev BP, Cox DJ, Gonder-Frederick LA, et al.: Assessment of risk for severe hypoglycemia among adults with IDDM: validation of the low blood glucose index. Diabetes Care 1998;21:1870–1875 [PubMed] [Google Scholar]
87. Rodbard D: Clinical interpretation of indices of quality of glycemic control and glycemic variability. Postgrad Med 2011;123:107–118 [PubMed] [Google Scholar]
88. Rodbard D, Bailey T, Jovanovic L, et al.: Improved quality of glycemic control and reduced glycemic variability with use of continuous glucose monitoring. Diabetes Technol Ther 2009;11:717–723 [PubMed] [Google Scholar]
89. Bragd J, Adamson U, Backlund LB, et al.: Can glycaemic variability, as calculated from blood glucose self-monitoring, predict the development of complications in type 1 diabetes over a decade? Diabetes Metab 2008;34(6 Pt 1):612–616 [PubMed] [Google Scholar]
90. Soupal J, Skrha J, Jr., Fajmon M, et al.: Glycemic variability is higher in type 1 diabetes patients with microvascular complications irrespective of glycemic control. Diabetes Technol Ther 2014;16:198–203 [PubMed] [Google Scholar]
91. Snell-Bergeon JK, Roman R, Rodbard D, et al.: Glycaemic variability is associated with coronary artery calcium in men with Type 1 diabetes: the Coronary Artery Calcification in Type 1 Diabetes study. Diabet Med 2010;27:1436–1442 [PMC free article] [PubMed] [Google Scholar]
92. Kovatchev BP, Cox DJ, Gonder-Frederick LA, Clarke W: Symmetrization of the blood glucose measurement scale and its applications. Diabetes Care 1997;20:1655–1658 [PubMed] [Google Scholar]
93. Hirsch IB: Glycemic variability: it’s not just about A1C anymore! Diabetes Technol Ther 2005;7:780–783 [PubMed] [Google Scholar]
94. Rodbard D: Hypo- and hyperglycemia in relation to the mean, standard deviation, coefficient of variation, and nature of the glucose distribution. Diabetes Technol Ther 2012;14:868–876 [PubMed] [Google Scholar]
95. Mazze RS, Strock E, Wesley D, et al.: Characterizing glucose exposure for individuals with normal glucose tolerance using continuous glucose monitoring and ambulatory glucose profile analysis. Diabetes Technol Ther 2008;10:149–159 [PubMed] [Google Scholar]
96. Mazze RS, Lucido D, Langer O, et al.: Ambulatory glucose profile: representation of verified self-monitored blood glucose data. Diabetes Care 1987;10:111–117 [PubMed] [Google Scholar]
97. Cryer PE: Hypoglycaemia: the limiting factor in the glycaemic management of type I and type II diabetes. Diabetologia 2002;45:937–948 [PubMed] [Google Scholar]
98. Zoungas S, Patel A, Chalmers J, et al.: Severe hypoglycemia and risks of vascular events and death. N Engl J Med 2010;363:1410–1418 [PubMed] [Google Scholar]
99. Seaquist ER, Miller ME, Bonds DE, et al.: The impact of frequent and unrecognized hypoglycemia on mortality in the ACCORD study. Diabetes Care 2012;35:409–414 [PMC free article] [PubMed] [Google Scholar]
100. McCoy RG, Van Houten HK, Ziegenfuss JY, et al.: Increased mortality of patients with diabetes reporting severe hypoglycemia. Diabetes Care 2012;35:1897–1901 [PMC free article] [PubMed] [Google Scholar]
101. Defining and reporting hypoglycemia in diabetes: a report from the American Diabetes Association Workgroup on Hypoglycemia. Diabetes Care 2005;28:1245–1249 [PubMed] [Google Scholar]
102. International Hypoglycaemia Study Group: Glucose concentrations of less than 3.0 mmol/L (54 mg/dL) should be reported in clinical trials: a joint position statement of the American Diabetes Association and the European Association for the Study of Diabetes. Diabetes Care 2017;40:155–157 [PubMed] [Google Scholar]
103. Bailey T, Bode BW, Christiansen MP, et al.: The performance and usability of a factory-calibrated flash glucose monitoring system. Diabetes Technol Ther 2015;17:787–794 [PMC free article] [PubMed] [Google Scholar]
104. Ish-Shalom M, Wainstein J, Raz I, Mosenzon O: Improvement in glucose control in difficult-to-control patients with diabetes using a novel flash glucose monitoring device. J Diabetes Sci Technol 2016;10:1412–1413 [PMC free article] [PubMed] [Google Scholar]
105. Bolinder J, Antuna R, Geelhoed-Duijvestijn P, et al.: Novel glucose-sensing technology and hypoglycaemia in type 1 diabetes: a multicentre, non-masked, randomised controlled trial. Lancet 2016;388:2254–2263 [PubMed] [Google Scholar]
106. Haak T, Hanaire H, Ajjan R, et al.: Flash glucose-sensing technology as a replacement for blood glucose monitoring for the management of insulin-treated type 2 diabetes: a multicenter, open-label randomized controlled trial. Diabetes Ther 2016;8:55–73 [PMC free article] [PubMed] [Google Scholar]
107. Bonora B, Maran A, Ciciliot S, et al.: Head-to-head comparison between flash and continuous glucose monitoring systems in outpatients with type 1 diabetes. J Endocrinol Invest 2016;39:1391–1399 [PubMed] [Google Scholar]
108. Dover AR, Stimson RH, Zammitt NN, Gibb FW: Flash glucose monitoring improves outcomes in a type 1 diabetes clinic. J Diabetes Sci Technol 2017;11(2):442–443 [PMC free article] [PubMed] [Google Scholar]