

 English
 Bahasa Melayu
 Bahasa Indonesia
 Tiếng Việt
 ไทย
ไทย
本翻譯僅作學術交流用,無商業意圖,請勿轉載,如有疑議問請來信
從1988至2010年,美國成人的平均體重指數(BMI)和腹部肥胖率大幅上升。尤其是年輕女性,腹部肥胖的增加最為顯著。研究發現,體育活動的缺乏與肥胖和腹部肥胖的增加密切相關,而每日卡路里攝取量則沒有顯著變化。這些數據強調了加強體育活動在公共健康管理中的重要性。
肥胖、腹部肥胖、體育活動及美國成人的卡路里攝取:1988-2010
Obesity, Abdominal Obesity, Physical Activity, and Caloric Intake in U.S. Adults: 1988-2010
Am J Med. Author manuscript; available in PMC 2015 Aug 5.
Published in final edited form as:
Am J Med. 2014 Aug; 127(8): 717–727.e12.
Published online 2014 Mar 11. doi: 10.1016/j.amjmed.2014.02.026
Uri Ladabaum, M.D., M.S.,1,2 Ajitha Mannalithara, Ph.D.,1,2 Parvathi A. Myer, M.D., M.H.S.,1,2 and Gurkirpal Singh, M.D.1,2
Author information Copyright and License information PMC Disclaimer
https://www.ncbi.nlm.nih.gov/pmc/articles/PMC4524881/
摘要
摘要
背景
肥胖和腹部肥胖都與疾病和死亡率獨立相關。體育活動可減少這些風險。我們研究了1988年至2010年間美國成人的肥胖、腹部肥胖、體育活動和卡路里攝取的趨勢。
方法
使用國家健康和營養檢查調查(NHANES)數據進行單變量和多變量分析。
結果
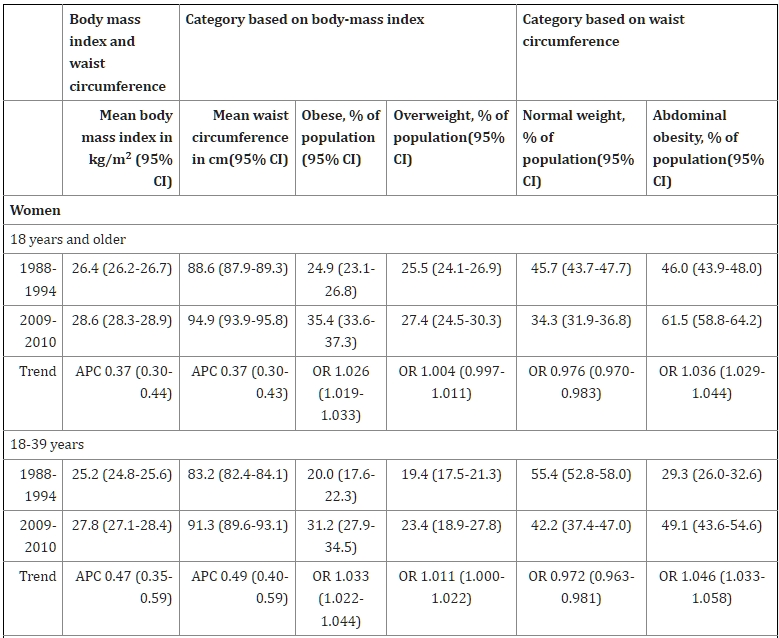
女性和男性的平均體重指數(BMI)每年增加0.37%(95% CI, 0.30-0.44%)。女性和男性的平均腰圍分別每年增加0.37%(95% CI, 0.30-0.43%)和0.27%(95% CI, 0.22-0.32%)。肥胖和腹部肥胖的盛行率大幅增加,超重成人的腹部肥胖盛行率也增加。年輕女性的增加最為明顯。報告沒有休閒時間體育活動的成人比例從女性的19.1%(95% CI, 17.3-21.0%)增加到51.7%(95% CI, 48.9-54.5%),男性從11.4%(95% CI, 10.0-12.8%)增加到43.5%(95% CI, 40.7-46.3%)。平均每日卡路里攝取沒有顯著變化。BMI和腰圍的趨勢與體育活動水平相關,但與卡路里攝取無關。與休閒時間體育活動的理想水平相比,沒有休閒時間體育活動的女性的調整BMI增加了8.3%(95% CI, 6.9-9.6%),男性增加了1.7%(95% CI, 0.68-2.8%)。
結論
我們的分析突顯了肥胖的公共健康問題的重要層面,包括年輕女性和腹部肥胖的趨勢,並支持醫學研究所對體育活動的重視。
關鍵詞:體重指數、腰圍、體重、飲食、運動、肥胖度、卡路里、肥胖、腹部肥胖、體育活動
Abstract
Background
Obesity and abdominal obesity are independently associated with morbidity and mortality. Physical activity attenuates these risks. We examined trends in obesity, abdominal obesity, physical activity, and caloric intake in U.S. adults from 1988 to 2010.
Methods
Univariate and multivariate analyses were performed using National Health and Nutrition Examination Survey (NHANES) data.
Results
Average body-mass index (BMI) increased by 0.37% (95% CI, 0.30-0.44%) per year in both women and men. Average waist circumference increased by 0.37% (95% CI, 0.30-0.43%) and 0.27% (95% CI, 0.22-0.32%) per year in women and men, respectively. The prevalence of obesity and abdominal obesity increased substantially, as did the prevalence of abdominal obesity among overweight adults. Younger women experienced the greatest increases. The proportion of adults who reported no leisure-time physical activity increased from 19.1% (95% CI, 17.3-21.0%) to 51.7% (95% CI, 48.9-54.5%) in women, and from 11.4% (95% CI, 10.0-12.8%) to 43.5% (95% CI, 40.7-46.3%) in men. Average daily caloric intake did not change significantly. BMI and waist circumference trends were associated with physical activity level, but not caloric intake. The associated changes in adjusted BMIs were 8.3% (95% CI, 6.9-9.6%) higher among women and 1.7% (95% CI, 0.68-2.8%) higher among men with no leisure-time physical activity compared to those with an ideal level of leisure-time physical activity.
Conclusions
Our analyses highlight important dimensions of the public health problem of obesity, including trends in younger women and in abdominal obesity, and lend support to the emphasis placed on physical activity by the Institute of Medicine.
Keywords: body-mass index, waist circumference, weight, diet, exercise, adiposity, calories, obesity, abdominal obesity, physical activity
引言
醫學研究所 (IOM) 將肥胖定義為國家重大的健康問題。1肥胖,定義為體重指數(BMI)≥30 kg/m2,與多種合併症相關,包括心血管疾病和癌症,且與全因死亡的高風險相關。1, 2 超重,定義為BMI為25.0-29.9 kg/m2,在多項研究中與增加的死亡風險有關。2-4 超過三分之二的美國成人被認為是肥胖或超重。5, 6 肥胖相關疾病的成本大約占美國每年健康保健支出的20%。1 由於肥胖的影響,預期壽命可能會下降。7
腰圍增加是獨立預測疾病和死亡的指標,即使在BMI正常的人群中也是如此。8-11 國家健康研究所建議在基礎醫療實踐中除了測量體重和身高外,還應測量腰圍,以幫助指導體重管理。12
肥胖的原因是多因素的,並反映了能量攝入和消耗之間的平衡。1, 13 體育活動是體重管理的關鍵組成部分。12 在IOM提出的五項建議中,以解決國家肥胖疫情,首先是將體育活動作為生活的固定和常規部分。1
我們的目的是描述在過去的二十年裡,美國成人的超重和肥胖、腹部肥胖、體育活動和卡路里攝入的趨勢和關聯。鑑於腰圍增加與BMI無關的健康風險,我們探討了在由BMI定義的各個層次中,腹部肥胖的盛行率趨勢,並探討了肥胖測量與體育活動和卡路里攝入水平之間的關係。
方法
資料來源
我們使用了來自國家健康和營養檢查調查(NHANES)的數據,從NHANES-III(1988-1994)開始,包括1999-2000到2009-2010年之間的連續NHANES 2年調查周期。14 每個周期的樣本均是使用分層、多階段、集群概率抽樣設計選擇的,詳細描述在之前已經提到。15, 16
研究人口
所有年齡在18歲及以上的參與者,除了懷孕婦女,都被納入研究。在卡路里攝入分析中,只有具有可靠和完整的24小時膳食回憶數據的合格參與者被納入。
針對自我識別的種族/民族子組進行了次群體分析,樣本足夠大:非西班牙裔白人、非西班牙裔黑人和墨西哥裔美國人。14
人體測量指標的定義
我們使用了來自國家健康和營養檢查調查(NHANES)的數據,從NHANES-III(1988-1994)開始,包括1999-2000到2009-2010年之間的連續NHANES 2年調查周期。14 每個周期的樣本均是使用分層、多階段、集群概率抽樣設計選擇的,詳細描述在之前已經提到。15, 16
為了研究肥胖、腹部肥胖和體育活動水平的趨勢,我們計算了每個調查周期的年齡調整比例和95% CI的國家估算。我們使用 logistic 回歸分析來評估隨時間的變化,將每個調查周期的中點作為一個連續變量包括在內。我們呈現反映在特定年份達到特定類別標準與前一年相比的機會比和95% CI。我們進行了單獨的分析,以研究肥胖成人的腹部肥胖趨勢,根據BMI定義。
根據三個預先指定的休閒時間體育活動水平,對肥胖和每日能量攝入的測量趨勢進行了分層分析。為了獨立研究體育活動和每日能量攝入的影響,我們進行了多變量回歸分析,以對數變換的BMI和腰圍作為響應變數,年份、體育活動水平和每日能量攝入作為解釋變數,根據年齡、年齡平方和性別進行調整。作為敏感性分析,我們首先僅使用了連續NHANES數據,可以估算總體育活動時間;其次,僅使用1999-2000年至2005-2006年的數據,包括與交通和家務工作相關的活動,因為這些周期的體育活動問卷保持一致(附錄)。
所有分析都是在SAS v9.3(SAS Institute Inc.,Cary,NC)中使用適當的調查程序執行的。調查設計變量和權重變量被用來考慮NHANES調查設計的複雜性,包括分層和群集。平均值和盛行率被年齡調整為2000年的美國標準人口。19
結果
體重指數和肥胖
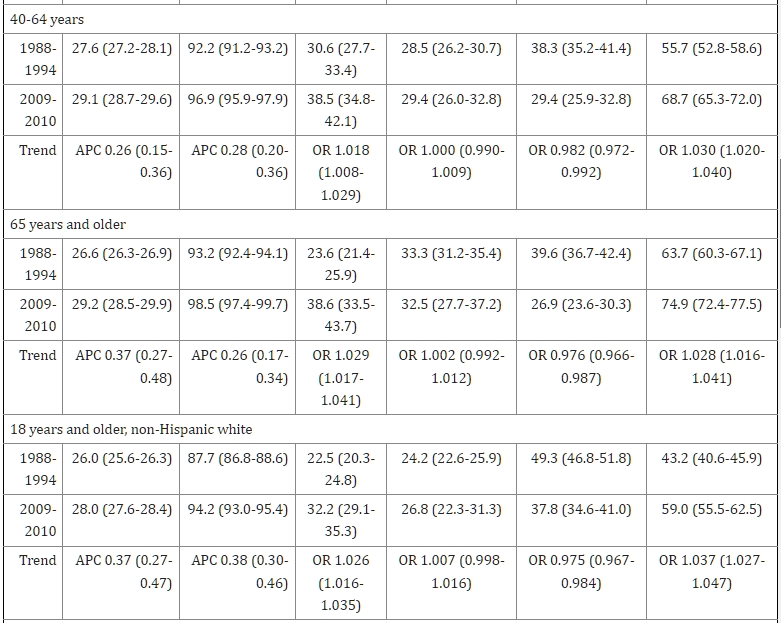
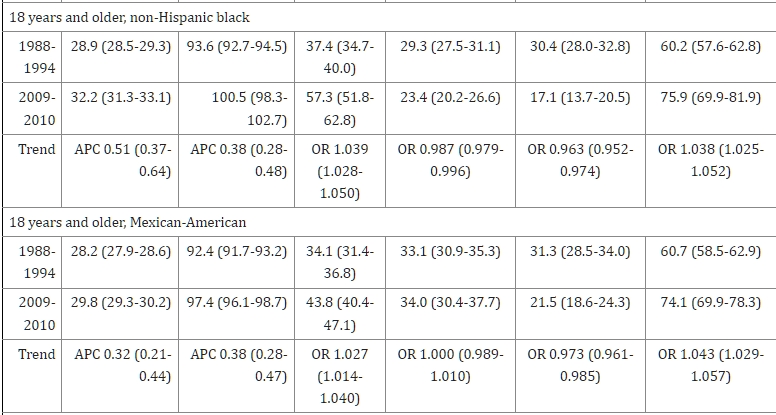
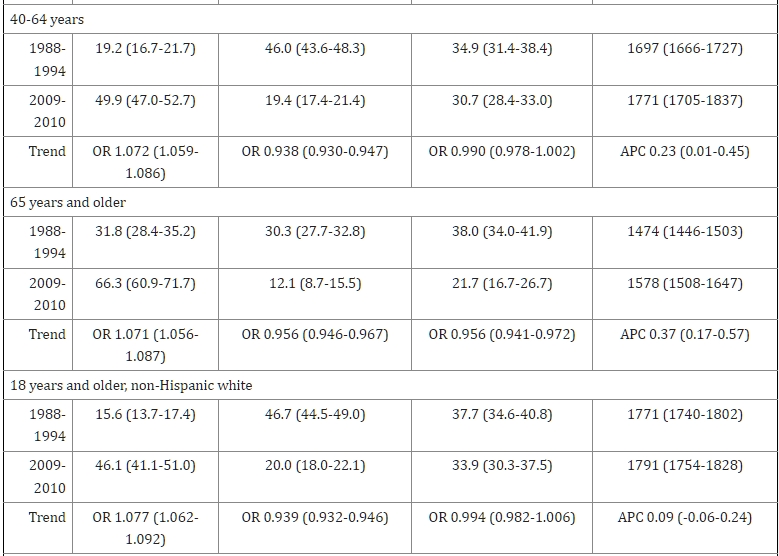
從1988-1994年到2009-2010年,美國的平均BMI在女性和男性中每年增加0.37%(95% CI,0.30-0.44%)。平均BMI在所有年齡和種族/族裔群體中都有增加(圖1,表1)。每年增加最多的年齡亞組是18-39歲的女性(表1)。Joinpoint分析只在女性中識別了平均BMI趨勢的變化,從1991年到2002年,每年增加0.60%(95% CI,0.50-0.69%),從2002年到2010年,每年增加0.22%(95% CI,0.11-0.32%)。在女性中,非西班牙裔黑人的平均BMI最高,非西班牙裔白人最低;在男性中,各種族/族裔群體之間的BMI相似(圖1,表1,附錄表1)。
圖1美國成年人平均體重指數(BMI)的趨勢,1988-2010年。(A)女性按年齡組別的趨勢。(B)男性按年齡組別的趨勢。(C)女性按種族/族裔組別的趨勢。(D)男性按種族/族裔組別的趨勢。
圖表1美國成年人1988年至2010年平均體重指數、腰圍和肥胖和腹部肥胖盛行率的趨勢 *
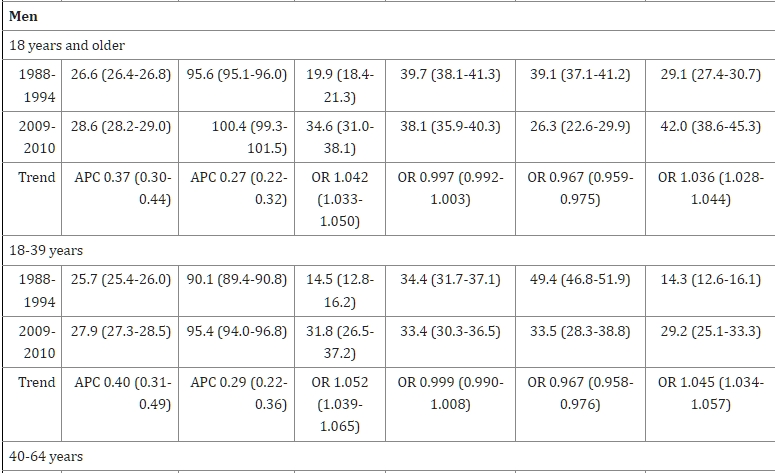
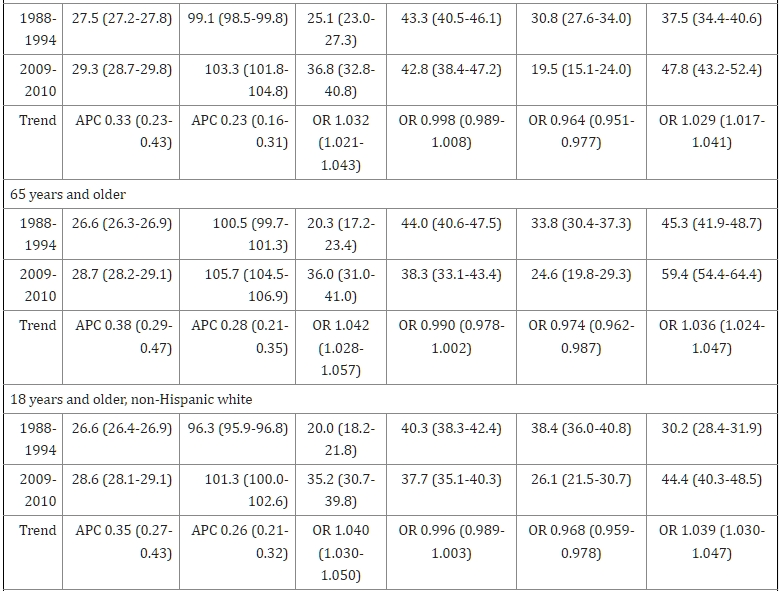
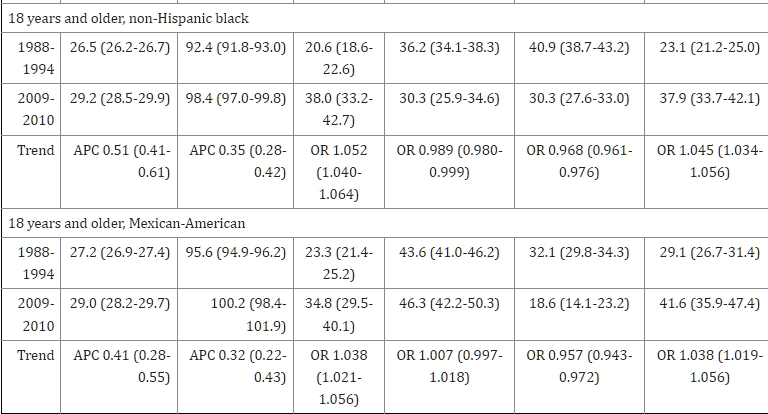
APC = 每年百分比變化(Annual Percentage Change);OR = 與前一年相比在特定類別的機率比(Odds Ratio)
附錄表1顯示了按年齡/種族別的結果。
肥胖的盛行率在女性中從24.9%(95% CI,23.1-26.8%)增加到35.4%(95% CI,33.6-37.3%),在男性中從19.9%(95% CI,18.4-21.3%)增加到34.6%(95% CI,31.0-38.1%)。這些增加與正常體重女性和男性比例的減少以及超重女性和男性比例的不變相關(表1)。與前一年相比,被分類為肥胖的機率在任何給定年份內為女性為1.026(95% CI,1.019-1.033),男性為1.042(95% CI,1.033-1.050)。所有年齡組中觀察到類似的趨勢(表1)。性別特定的種族/族裔組別在肥胖盛行率方面的差異與BMI結果相似(表1,附錄圖1,附錄表1)。
腰圍和腹部肥胖
女性每年平均腰圍增加0.37%(95% CI,0.30-0.44%),男性每年平均腰圍增加0.27%(95% CI,0.22-0.32%)。平均腰圍的增加在所有年齡和種族/族裔組別中均有觀察到(圖2,表1)。與BMI一樣,平均腰圍每年增加最多的是18-39歲的女性(表1)。在女性中,非西班牙裔黑人的平均腰圍最大,非西班牙裔白人最小;相反,在男性中,非西班牙裔白人的平均腰圍最大,非西班牙裔黑人最小(圖2,表1,附錄表1)。
圖2美國成年人平均腰圍的趨勢,1988-2010年。 (A)按年齡組別劃分的女性趨勢。 (B)按年齡組別劃分的男性趨勢。 (C)按種族/族裔組別劃分的女性趨勢。 (D)按種族/族裔組別劃分的男性趨勢。
平均腰圍的變化與腹部肥胖的盛行率增加相關(附錄圖2,表1),女性從46.0%(95% CI,43.9-48.0%)增加到61.5%(95% CI,58.8-64.2%),男性則從29.1%(95% CI,27.4-30.7%)增加到42.0%(95% CI,38.6-45.3%)。年輕人的年度增長最為明顯,但隨著年齡的增長,腹部肥胖的盛行率也增加(表1)。種族/族裔組別在腹部肥胖盛行率方面的性別差異與腰圍結果相似(表1,附錄圖2,附錄表1)。
根據體重指數分類的腹部肥胖情況
根據BMI分類為正常體重的成年人中,腹部肥胖的盛行率只在女性中顯著增加,從9.6%(95% CI,8.1-11.0%)增加到13.8%(95% CI,10.1-17.5%)(附錄表2)。
根據BMI分類為超重的成年人中,腹部肥胖的盛行率在女性中從66.1%(95% CI,62.7-69.4%)增加到80.8%(95% CI,78.1-83.5%),在男性中從24.5%(95% CI,22.1-26.8%)增加到27.8%(95% CI,24.3-31.3%)(附錄表2)。與前一年相比,女性在某一年達到腹部肥胖標準的機會比率為1.045(95% CI,1.032-1.057),而男性超重者的機會比率為1.017(95% CI,1.007-1.027)。
根據BMI分類為肥胖的大多數(>90%)美國成年人也被歸類為患有腹部肥胖(附錄表2)。
附錄表2顯示了按年齡組別劃分的結果。
身體活動
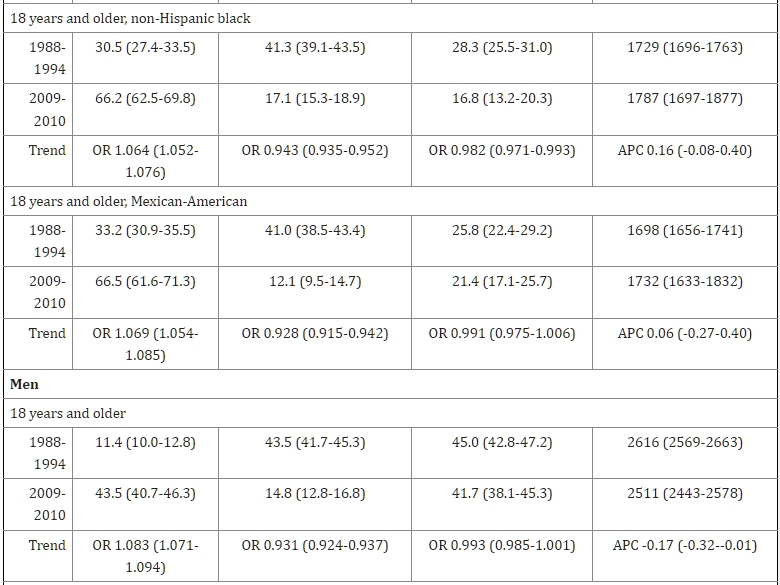
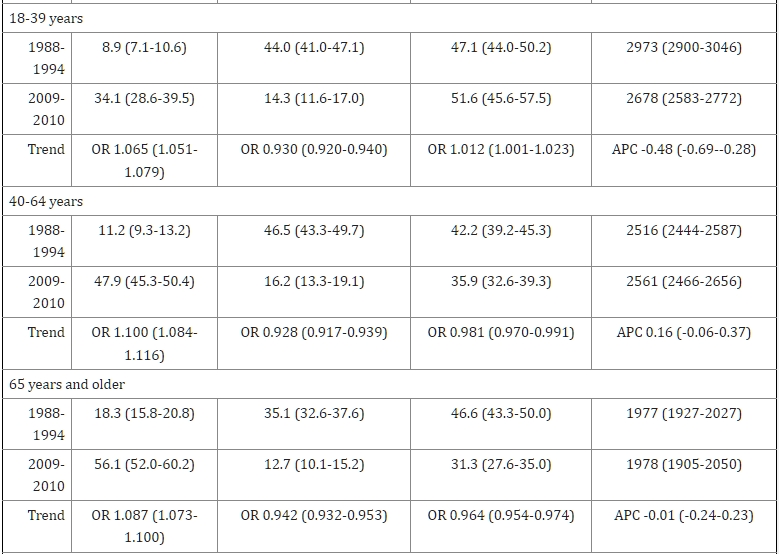
報告沒有休閒時間體育活動的成年人比例在女性中從19.1%(95% CI,17.3-21.0%)增加到51.7%(95% CI,48.9-54.5%),在男性中從11.4%(95% CI,10.0-12.8%)增加到43.5%(95% CI,40.7-46.3%)。這些變化伴隨著報告中等或理想休閒時間體育活動水平的成年人比例下降(表2)。與前一年相比,女性和男性在特定年份報告沒有休閒時間體育活動的機會比例分別為1.074(95% CI,1.064-1.084)和1.083(95% CI,1.071-1.094)(表2)。在女性和男性中,報告沒有休閒時間體育活動的比例在非西班牙裔黑人和墨西哥裔美國人中高於非西班牙裔白人(表2)。表2和附錄表3顯示了按年齡和種族/族裔劃分的結果。
圖表2休閒時間體育活動水平和每日卡路里攝入水平的報告趨勢,美國成年人,1988-2010年*
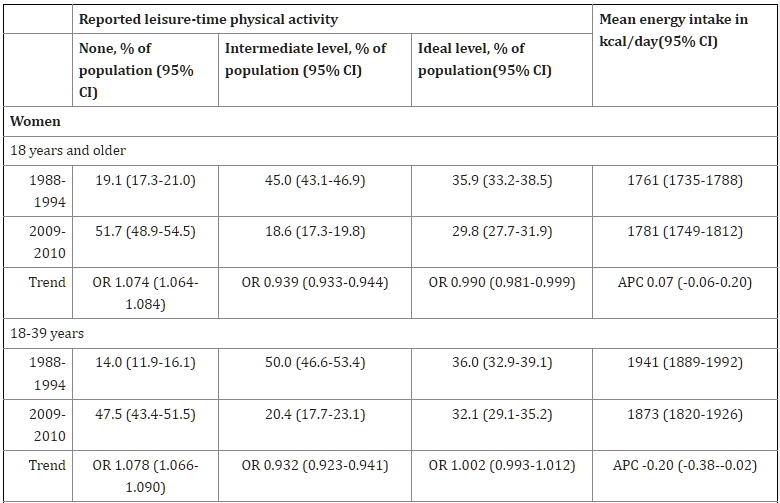
APC = 年度百分比變化;OR = 與前一年相比所處類別的機會比率
附錄表3顯示了按年齡/種族別的結果
卡路里攝取
整體而言,無論是女性還是男性,或者按種族/族裔劃分,平均每日卡路里攝取量並未在一段時間內出現顯著變化(表2)。結果因年齡、性別和休閒時間體育活動水平而異(表3,附錄表4)。對於聲稱沒有進行休閒時間體育活動的女性來說,每日平均卡路里攝取量有顯著增加,而對於聲稱達到理想休閒時間體育活動水平的男性來說,每日平均卡路里攝取量則有顯著減少(表3)。
圖表3根據報告的休閒時間體育活動水平,1988年至2010年間,肥胖、腹部肥胖和每日卡路里攝取量的盛行趨勢。
體重指數和肥胖根據體育活動層別
平均體重指數(BMI)在所有三個休閒時間體育活動層別的女性和男性中均有增加(附錄表4)。幾乎所有按休閒時間體育活動劃分的年齡和性別子組中,平均BMI都有增加(附錄表4)。肥胖的盛行率在三個休閒時間體育活動層別的女性和男性中均有增加(表3)。在不同種族/民族群體中也觀察到相似的模式(未顯示數據)。
腰圍和腹部肥胖根據體育活動層別
平均腰圍在三個休閒時間體育活動層別的女性和男性中隨時間增加(附錄表4)。幾乎所有按休閒時間體育活動劃分的年齡和性別子組中,平均腰圍都有增加(附錄表4)。腹部肥胖的盛行率在三個休閒時間體育活動層別的女性和男性中均有增加(表3)。在不同種族/民族群體中也觀察到相似的模式(未顯示數據)。
體重指數和腰圍:與休閒時間體育活動和熱量攝入的關聯
在調整了休閒時間體育活動、熱量攝入和年齡後,BMI和腰圍在女性和男性中均顯著增加。增加的幅度與休閒時間體育活動水平有關,但與熱量攝入無關。
與BMI相關的變化在女性中,休閒時間體育活動中等水平的變化比休閒時間體育活動理想水平的女性高5.5%(95% CI,4.3-6.7%),而無休閒時間體育活動的女性則高8.3%(95% CI,6.9-9.6%)。對於男性,相應的數據分別高1.2%(95% CI,0.15-2.2%)和1.7%(95% CI,0.68-2.8%)。
與腰圍相關的變化在女性中,休閒時間體育活動中等水平的變化比休閒時間體育活動理想水平的女性高4.2%(95% CI,3.3-5.0%),而無休閒時間體育活動的女性則高6.4%(95% CI,5.4-7.4%)。對於男性,相應的數據分別高2.1%(95% CI,1.4-2.9%)和2.5%(95% CI,1.7-3.3%)。
在按種族/民族分層的分析中,BMI和腰圍的增加與休閒時間體育活動水平的關聯對於非西班牙裔白人女性和男性以及墨西哥裔女性是具有統計學意義的(附錄表5)。
敏感性分析顯示了相似的結果(附錄)。
討論
我們的分析突顯了肥胖在美國的公共衛生問題的重要維度。在過去的二十年中,無論是在女性還是男性中,平均BMI、平均腰圍、肥胖的患病率以及腹部肥胖的患病率都大幅增加。BMI的年均增加在年輕女性中最為明顯,腹部肥胖患病率的最大增加出現在年輕女性和男性中,而肥胖和腹部肥胖都優先影響了非西班牙裔黑人女性。此外,腹部肥胖的患病率在正常體重的女性中以及在超重的女性和男性中都有所增加。這些變化發生在報告沒有休閒時間體育活動的成年人比例大幅增加的背景下,但在日常熱量攝入平均水平上並未出現任何顯著的人口層面變化。在人口層面上,我們發現休閒時間體育活動水平與BMI和腰圍的增加之間存在顯著的聯繫,但與每日熱量攝入無關。
儘管美國肥胖的整體趨勢已得到廣泛認可,並且肥胖患病率可能正在穩定,但我們的分析突顯了年輕成年人、女性和腹部肥胖患病率的令人不安的趨勢,以及持續存在的種族/民族差異。總的來說,正常體重的女性以及超重的女性和男性變得更加「腹部肥胖」。考慮到肥胖患病率在1999-2010年間在2-19歲男性中有顯著增加,但在女性中則沒有增加,年輕成年女性可能特別容易變得容易增重。對於單純超重是否增加死亡風險仍然存在爭議,但在超重者中腹部肥胖的趨勢令人擔憂,因為這與BMI無關的腰圍增加風險相關。我們的研究結果不支持一個流行的觀點,即美國肥胖的上升主要可以歸因於美國人日常熱量攝入的長期增加。我們發現在過去的二十年中,平均每日熱量攝入並未增加的任何證據。先前的分析已經注意到了較長時間段內的增加,但最近則有所減少。相反,我們的分析確定了報告的休閒時間體育活動水平與肥胖的所有測量指標之間存在顯著聯繫。其他調查者已經研究過這種關係。缺乏體育活動是獨立的死亡預測因子。體育活動可以預防體重增加,並減輕與肥胖相關的增加死亡風險。然而,單純的體育活動水平並不能保證達到正常體重。
我們的結果是基於一系列橫斷面調查,而不是前瞻性的群體研究。它們並不意味著在個體層面上熱量攝入不是肥胖的重要決定因素。對NHANES 1971-1975至1999-2002的先前分析報告稱,食物能量密度增加幾乎與美國肥胖患病率平行增加。飲食組成在人群層面上可能是相關的,但我們在研究期間的每日脂肪、碳水化合物和蛋白質攝入量沒有顯著變化(附錄表6)。然而,對主要的大分子的分析並不涉及特定的卡路里來源,比如簡單糖,以及與基因風險的相互作用。腸道菌群對宿主代謝的影響開始被探討。
我們的結果應該在現有研究的背景下看待。僅限於較近時期的研究表明,美國成年人的肥胖患病率趨勢可能正在穩定。我們在女性BMI的joinpoint分析與這些結果一致。盡管如此,肥胖患病率仍然過高。腹部肥胖的趨勢可能部分反映了出生年代效應。一些但不是所有關於體育活動趨勢的先前研究得出了與我們類似的結論。結果的多樣性可能部分是由於調查和研究方法的多樣性引起的。
我們的研究存在一些局限性。NHANES調查未來潛在的參與者群體,因此我們報告的與體育活動的相關性必須謹慎解釋。雖然測量了身高、體重和腰圍,但卡路里攝入和體育活動是自報告的,我們分析了24小時的卡路里攝入。卡路里攝入可能被低估,而體育活動可能被高估,但這不能解釋我們研究中高比例的無休閒體育活動。多年來調查方法的變化可能會影響體育活動估計。我們使用了周期中點作為連續變數。
社會考慮值得討論。肥胖是一個跨越種族、民族和社會經濟群體的公共衛生問題,但非裔美國人、西班牙裔、教育程度較低的人、年長者和一些州受到的影響不成比例。儘管超重和肥胖的趨勢,但自我診斷、臨床診斷和在初級醫療中的體重輔導率已經下降。社會現實,包括對個人和政府角色的不同看法,增加了醫療環境中遇到的挑戰。 IOM提出的與體育活動環境相關的第一個目標是將體育活動納入生活的一個組成部分並使其成為例行活動的一部分。IOM還建議改變有關體育活動和營養的信息,強調在促進健康方面健康保健提供者、保險公司、雇主和學校的角色,體育活動是一個主要焦點。
總結而言,從1998年至2010年,美國成年人的平均體重指數(BMI)和腰圍均有增加。腹部肥胖,一個獨立的死亡預測因素,已在正常體重的女性和超重的女性和男性中變得更加普遍。在人口層面上,我們發現報告的休閒體育活動水平與肥胖之間存在關聯,但即使在報告達到理想休閒體育活動水平的成年人中,肥胖的患病率也有增加。盡管美國的肥胖率可能穩定下降,但我們的結果支持了IOM對肥胖問題的重視,特別強調了體育活動的重要性。
臨床意義
從1998年至2010年,美國成年人的平均體重指數(BMI)和腰圍,肥胖和腹部肥胖患病率,以及報告沒有休閒體育活動的人口比例都有大幅增加。BMI和腰圍的趨勢與體育活動水平有關,但與每日卡路里攝入量無關。
儘管美國的肥胖率可能穩定下降,但我們的結果支持IOM對肥胖問題的重視。
參考文獻
1. Accelerating Progress in Obesity Prevention: Solving the Weight of the Nation. Washington, DC: IOM (Institute of Medicine); 2012. [PMC free article] [PubMed] [Google Scholar]2. Flegal KM, Kit BK, Orpana H, Graubard BI. Association of all-cause mortality with overweight and obesity using standard body mass index categories: a systematic review and meta-analysis. JAMA. 2013;309(1):71–82. [PMC free article] [PubMed] [Google Scholar]3. Adams KF, Schatzkin A, Harris TB, et al. Overweight, obesity, and mortality in a large prospective cohort of persons 50 to 71 years old. N Engl J Med. 2006;355(8):763–78. [PubMed] [Google Scholar]4. Berrington de Gonzalez A, Hartge P, Cerhan JR, et al. Body-mass index and mortality among 1.46 million white adults. N Engl J Med. 2010;363(23):2211–9. [PMC free article] [PubMed] [Google Scholar]5. Flegal KM, Carroll MD, Ogden CL, Curtin LR. Prevalence and trends in obesity among US adults, 1999-2008. JAMA. 2010;303(3):235–41. [PubMed] [Google Scholar]6. Flegal KM, Carroll MD, Kit BK, Ogden CL. Prevalence of obesity and trends in the distribution of body mass index among US adults, 1999-2010. JAMA. 2012;307(5):491–7. [PubMed] [Google Scholar]7. Olshansky SJ, Passaro DJ, Hershow RC, et al. A potential decline in life expectancy in the United States in the 21st century. N Engl J Med. 2005;352(11):1138–45. [PubMed] [Google Scholar]8. Clinical guidelines on the identification, evaluation, and treatment of overweight and obesity in adults: The evidence report. Washington, DC: National Heart, Lung and Blood Institutes, National Institutes of Health; 1998. [PubMed] [Google Scholar]9. Pischon T, Boeing H, Hoffmann K, et al. General and abdominal adiposity and risk of death in Europe. N Engl J Med. 2008;359(20):2105–20. [PubMed] [Google Scholar]10. Koster A, Leitzmann MF, Schatzkin A, et al. Waist circumference and mortality. Am J Epidemiol. 2008;167(12):1465–75. [PubMed] [Google Scholar]11. Jacobs EJ, Newton CC, Wang Y, et al. Waist circumference and all-cause mortality in a large US cohort. Arch Intern Med. 2010;170(15):1293–301. [PubMed] [Google Scholar]12. The Practical Guide Identification, Evaluation, and Treatment of Overweight and Obesity in Adults. Washington, DC: National Heart, Lung and Blood Institutes, National Institutes of Health; 2000. [Google Scholar]13. Mozaffarian D, Hao T, Rimm EB, et al. Changes in diet and lifestyle and long-term weight gain in women and men. N Engl J Med. 2011;364(25):2392–404. [PMC free article] [PubMed] [Google Scholar]14. Centers for Disease Control and Prevention (CDC). National Center for Health Statistics (NCHS) National Health and Nutrition Examination Survey Data. Hyattsville, MD: [Accessed April 17, 2013]. http://www.cdc.gov/nchs/nhanes/nhanes_questionnaires.htm. [Google Scholar]15. National Center for Health Statistics. The Third National Health and Nutrition Examination Survey, 1988–1994. Hyattsville, MD: 1996. [Accessed April 17, 2013]. Analytical and Reporting Guidelines. at http://www.cdc.gov/nchs/data/nhanes/nhanes3/nh3gui.pdf. [Google Scholar]16. National Center for Health Statistics. The National Health and Nutrition Examination Survey (NHANES) Hyattsville, MD: 2005. [Accessed April 17, 2013]. Analytical and Reporting Guidelines. at http://www.cdc.gov/nchs/data/nhanes/nhanes_03_04/nhanes_analytic_guidelines_dec_2005.pdf. [Google Scholar]17. Lean ME, Han TS, Morrison CE. Waist circumference as a measure for indicating need for weight management. BMJ. 1995;311(6998):158–61. [PMC free article] [PubMed] [Google Scholar]18. Kim HJ, Fay MP, Feuer EJ, Midthune DN. Permutation tests for joinpoint regression with applications to cancer rates. Stat Med. 2000;19(3):335–51. [PubMed] [Google Scholar]19. Day Jennifer Cheeseman. U S Bureau of the Census, Current Population Reports. U.S. Government Printing Office; Washington, DC: 1996. [Accessed April 17, 2013]. Population Projections of the United States by Age, Sex, Race, and Hispanic Origin: 1995 to 2050; pp. 25–1130. at http://www.census.gov/prod/1/pop/p25-1130/p251130.pdf. [Google Scholar]20. Okosun IS, Chandra KM, Boev A, et al. Abdominal adiposity in U.S. adults: prevalence and trends, 1960-2000. Prev Med. 2004;39(1):197–206. [PubMed] [Google Scholar]21. Li C, Ford ES, McGuire LC, Mokdad AH. Increasing trends in waist circumference and abdominal obesity among US adults. Obesity (Silver Spring, Md) 2007;15(1):216–24. [PubMed] [Google Scholar]22. Ogden CL, Carroll MD, Kit BK, Flegal KM. Prevalence of obesity and trends in body mass index among US children and adolescents, 1999-2010. JAMA. 2012;307(5):483–90. [PMC free article] [PubMed] [Google Scholar]23. Casazza K, Fontaine KR, Astrup A, et al. Myths, presumptions, and facts about obesity. N Engl J Med. 2013;368(5):446–54. [PMC free article] [PubMed] [Google Scholar]24. Austin GL, Ogden LG, Hill JO. Trends in carbohydrate, fat, and protein intakes and association with energy intake in normal-weight, overweight, and obese individuals: 1971-2006. The American journal of clinical nutrition. 2011;93(4):836–43. [PubMed] [Google Scholar]25. Ford ES, Dietz WH. Trends in energy intake among adults in the United States: findings from NHANES. The American journal of clinical nutrition. 2013;97(4):848–53. [PMC free article] [PubMed] [Google Scholar]26. Qi Q, Li Y, Chomistek AK, et al. Television watching, leisure time physical activity, and the genetic predisposition in relation to body mass index in women and men. Circulation. 2012;126(15):1821–7. [PMC free article] [PubMed] [Google Scholar]27. Weinsier RL, Hunter GR, Heini AF, et al. The etiology of obesity: relative contribution of metabolic factors, diet, and physical activity. Am J Med. 1998;105(2):145–50. [PubMed] [Google Scholar]28. Hu FB, Willett WC, Li T, et al. Adiposity as compared with physical activity in predicting mortality among women. N Engl J Med. 2004;351(26):2694–703. [PubMed] [Google Scholar]29. Hankinson AL, Daviglus ML, Bouchard C, et al. Maintaining a high physical activity level over 20 years and weight gain. JAMA. 2010;304(23):2603–10. [PMC free article] [PubMed] [Google Scholar]30. Koster A, Harris TB, Moore SC, et al. Joint associations of adiposity and physical activity with mortality: the National Institutes of Health-AARP Diet and Health Study. Am J Epidemiol. 2009;169(11):1344–51. [PMC free article] [PubMed] [Google Scholar]31. Sui X, LaMonte MJ, Laditka JN, et al. Cardiorespiratory fitness and adiposity as mortality predictors in older adults. JAMA. 2007;298(21):2507–16. [PMC free article] [PubMed] [Google Scholar]32. Kant AK, Graubard BI. Secular trends in patterns of self-reported food consumption of adult Americans: NHANES 1971-1975 to NHANES 1999-2002. The American journal of clinical nutrition. 2006;84(5):1215–23. [PMC free article] [PubMed] [Google Scholar]33. Qi Q, Chu AY, Kang JH, et al. Sugar-sweetened beverages and genetic risk of obesity. N Engl J Med. 2012;367(15):1387–96. [PMC free article] [PubMed] [Google Scholar]34. Tremaroli V, Backhed F. Functional interactions between the gut microbiota and host metabolism. Nature. 2012;489(7415):242–9. [PubMed] [Google Scholar]35. Yanovski SZ, Yanovski JA. Obesity prevalence in the United States–up, down, or sideways? N Engl J Med. 2011;364(11):987–9. [PMC free article] [PubMed] [Google Scholar]36. Robinson WR, Utz RL, Keyes KM, et al. Birth cohort effects on abdominal obesity in the United States: the Silent Generation, Baby Boomers and Generation X. International journal of obesity (2005) 2012 [PMC free article] [PubMed] [Google Scholar]37. Pleis JR, Lucas JW. Summary health statistics for U.S. adults: National Health Interview Survey, 2007. Vital and health statistics Series 10, Data from the National Health Survey. 2009;(240):1–159. [PubMed] [Google Scholar]38. Tucker JM, Welk GJ, Beyler NK. Physical activity in U.S.: adults compliance with the Physical Activity Guidelines for Americans. Am J Prev Med. 2011;40(4):454–61. [PubMed] [Google Scholar]39. Barry CL, Gollust SE, Niederdeppe J. Are Americans ready to solve the weight of the nation? N Engl J Med. 2012;367(5):389–91. [PubMed] [Google Scholar]40. Vital signs: state-specific obesity prevalence among adults — United States, 2009. MMWR Morb Mortal Wkly Rep. 2010;59(30):951–5. [PubMed] [Google Scholar]41. Kraschnewski JL, Sciamanna CN, Stuckey HL, et al. A silent response to the obesity epidemic: decline in US physician weight counseling. Med Care. 2013;51(2):186–92. [PubMed] [Google Scholar]42. Yates EA, Macpherson AK, Kuk JL. Secular trends in the diagnosis and treatment of obesity among US adults in the primary care setting. Obesity (Silver Spring, Md) 2012;20(9):1909–14. [PubMed] [Google Scholar]