

 English
 Bahasa Melayu
 Bahasa Indonesia
 Tiếng Việt
 ไทย
ไทย
本翻譯僅作學術交流用,無商業意圖,請勿轉載,如有疑議問請來信
透過對8601篇文章的綜合評估,發現高糖飲食與18種內分泌/代謝疾病、10種心血管疾病、7種癌症及其他多種健康問題有顯著不良關聯。研究建議將自由糖或添加糖的日攝取量控制在25克以下,並限制含糖飲料的攝取量為每周少於一份,以減少糖對健康的不良影響。
Yin Huang, doctoral student1, Zeyu Chen, resident physician1, Bo Chen, doctoral student1, Jinze Li, doctoral student1, Xiang Yuan, masters student2, Jin Li, doctoral student1, Wen Wang, associate professor3, Tingting Dai, attending physician4, Hongying Chen, consultant physician5, Yan Wang, consultant physician5, Ruyi Wang, attending physician1, Puze Wang, masters student1, Jianbing Guo, attending physician1, Qiang Dong, professor1, Chengfei Liu, professor6, Qiang Wei, professor1, Dehong Cao, associate professor1, Liangren Liu, associate professor1
BMJ 2023; 381 doi: https://doi.org/10.1136/bmj-2022-071609 (Published 05 April 2023)Cite this as: BMJ 2023;381:e071609
Abstract
Objective
To evaluate the quality of evidence, potential biases, and validity of all available studies on dietary sugar consumption and health outcomes.
Design
Umbrella review of existing meta-analyses.
Data sources
PubMed, Embase, Web of Science, Cochrane Database of Systematic Reviews, and hand searching of reference lists.
Inclusion criteria
Systematic reviews and meta-analyses of randomised controlled trials, cohort studies, case-control studies, or cross sectional studies that evaluated the effect of dietary sugar consumption on any health outcomes in humans free from acute or chronic diseases.
Results
The search identified 73 meta-analyses and 83 health outcomes from 8601 unique articles, including 74 unique outcomes in meta-analyses of observational studies and nine unique outcomes in meta-analyses of randomised controlled trials. Significant harmful associations between dietary sugar consumption and 18 endocrine/metabolic outcomes, 10 cardiovascular outcomes, seven cancer outcomes, and 10 other outcomes (neuropsychiatric, dental, hepatic, osteal, and allergic) were detected. Moderate quality evidence suggested that the highest versus lowest dietary sugar consumption was associated with increased body weight (sugar sweetened beverages) (class IV evidence) and ectopic fatty accumulation (added sugars) (class IV evidence). Low quality evidence indicated that each serving/week increment of sugar sweetened beverage consumption was associated with a 4% higher risk of gout (class III evidence) and each 250 mL/day increment of sugar sweetened beverage consumption was associated with a 17% and 4% higher risk of coronary heart disease (class II evidence) and all cause mortality (class III evidence), respectively. In addition, low quality evidence suggested that every 25 g/day increment of fructose consumption was associated with a 22% higher risk of pancreatic cancer (class III evidence).
Conclusions
High dietary sugar consumption is generally more harmful than beneficial for health, especially in cardiometabolic disease. Reducing the consumption of free sugars or added sugars to below 25 g/day (approximately 6 teaspoons/day) and limiting the consumption of sugar sweetened beverages to less than one serving/week (approximately 200-355 mL/week) are recommended to reduce the adverse effect of sugars on health.
摘要
目的
評估所有可用研究關於膳食糖攝入與健康結果之質量、潛在偏見和效度。
設計
對現有的荟萃分析進行綜述式文獻回顧。
資料來源
PubMed、Embase、Web of Science、Cochrane系統評論庫,以及手動檢索參考文獻清單。
納入標準
評估了膳食糖攝入對人類健康結果的影響,並排除了急性或慢性疾病的人群,包括隨機對照試驗、前瞻性研究、病例對照研究或橫斷面研究的系統評論和荟萃分析。
結果
搜索識別出73個荟萃分析和83個健康結果,來自8601篇唯一的文章,其中包括74個觀察研究荟萃分析中的唯一結果,以及九個隨機對照試驗荟萃分析中的唯一結果。發現膳食糖攝入與18種內分泌/代謝結果、10種心血管結果、七種癌症結果以及10種其他結果(神經精神、牙齒、肝臟、骨骼和過敏)之間存在顯著的有害聯繫。中等質量的證據表明,最高與最低膳食糖攝入之間的關聯與體重增加(含糖飲料)(Ⅳ類證據)和異位脂肪積聚(添加糖)(Ⅳ類證據)有關。低質量的證據顯示,每週每份的含糖飲料攝入量與痛風風險增加4%(Ⅲ類證據),每天每250毫升的含糖飲料攝入量與冠心病風險和全因死亡風險分別增加17%(Ⅱ類證據)和4%(Ⅲ類證據)。此外,低質量的證據表明,每天每25克的果糖攝入量與胰腺癌風險增加22%(Ⅲ類證據)。
結論
高膳食糖攝入對健康通常更有害無益,尤其是對心脏代谢疾病。建議將自由糖或添加糖的攝入量控制在每天25克以下(約6茶匙/天),並將含糖飲料的攝入量限制在每週不到一份(約200-355毫升/週),以減少糖對健康的不利影響。
引言
作為人類飲食的重要組成部分,醣類幾十年來一直被顯示與各種風險因素有害相關,主要包括肥胖、糖尿病、心血管疾病、高尿酸血症、痛風、異位脂肪積聚、齲齒以及一些癌症 。 根據世界衛生組織和聯合國糧食及農業組織的最新報告,醣類包括單醣、雙醣、多元醇和自由糖,其中自由糖被確定為所有由製造商、廚師或消費者添加到食物中的單醣 和雙醣,以及天然存在於蜂蜜、糖漿和果汁中的糖。 此外,另一個重要的醣類群體,添加糖,在美國膳食指南中被提出,並被定義為在加工和製備食品和飲料中使用的所有單醣和雙醣,以及添加到食品中但不是天然 存在的糖,如水果和果汁中的糖。
表1 飲食中醣類的分類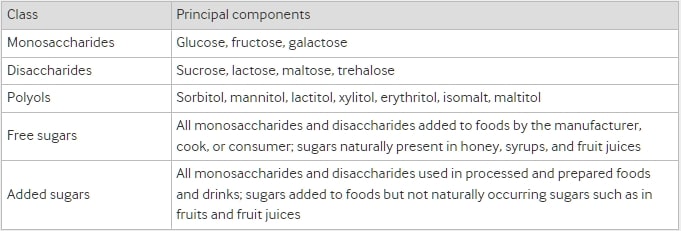
近年來,許多研究集中關注了含糖飲料對人類健康的不良影響,這是因為這些飲料對總添加糖或自由糖攝取量的重要貢獻很大,而且它們的消費速度迅速增長。 一般來說,含糖飲料是添加糖最主要的來源,包括碳酸軟性飲料、非碳酸軟性飲料、果汁飲料以及運動和能量飲料。 先前的調查顯示,儘管消費水準仍然很高,但在許多已開發國家,含糖飲料的消費正在下降。 然而,在許多發展中國家,含糖飲料的消費仍在增加,這可能歸因於它們在經濟發展的同時變得更加易得。 可口可樂公司2007年的年度報告顯示,印度和中國的含糖飲料消費量在一年內分別增加了14%和18%。 2018年,一項針對中國小學和初中學生的橫斷面調查顯示,含糖飲料提供了學生總熱量消耗的10-15%。 美國國家健康與營養調查(NHANES)的數據顯示,2009-10年,含糖飲料消費分別占美國兒童/青少年和成人每日能量攝取量的8%和6.9%。 此外,2010年進行的全球調查報告顯示,全球約有18萬個與肥胖相關的死亡與含糖飲料的消費有關。 所有這些發現促進了全球範圍內限製糖消費的政策發展,包括糖稅、食品標籤法律以及對廣告和行銷的限制。 同時,世界衛生組織、美國農業部以及美國衛生與公眾服務部等國家和國際組織已建議將自由糖或添加糖的攝取量限制在總每日能量攝取量的10%以下。
儘管近幾十年來已發表了許多關於糖消費與一系列健康結果相關性的觀察性研究和隨機對照試驗的薈萃分析,但研究設計的不足、飲食糖消費的不同測量方法、結果的不一致以及曝光 定義的不同,使得得出明確結論變得困難。 因此,在製定詳細的糖限制政策之前,需要全面評估現有證據質量,以確定飲食糖消費與所有健康結果之間的關聯。 為了評估所有關於飲食糖攝取量與任何健康結果之間關聯的證據品質、潛在偏差和有效性,我們對此主題進行了薈萃分析。
方法
傘審閱方法
我們系統地從已發表的系統性評論和荟萃分析中搜索、提取和分析了大量數據,這些數據研究了各種健康結果與飲食糖消耗之間的關聯。3940 一般來說,飲食糖的消耗可以通過食品中糖的特定比例或總能量的百分比來衡量並結合在荟萃分析中。3 因此,我們從我們的傘審中排除了沒有荟萃分析的簡單系統性評論。我們預先在PROSPERO(CRD42022300982)中登記了這個傘審(https://www.crd.york.ac.uk/PROSPERO/)。
文獻搜索
我們搜索了PubMed、Embase、Web of Science和Cochrane系統性評論數據庫從成立至2022年1月(上次更新)的系統性評論和荟萃分析,隨機對照試驗和觀察性研究。我們通過醫學主題詞、關鍵詞和與糖有關的文本詞的變體的組合來搜索數據庫,按照蘇格蘭同行指南的指導進行文獻搜索:(糖或糖)和(系統性評論或荟萃分析)。41 兩位作者(YH和ZYC)分別進行了電子搜索,篩選了從數據庫檢索的標題和摘要,並通過閱讀全文確定符合納入標準的荟萃分析。兩位審查者之間的文獻篩選任何不一致之處由第三位作者(LRL)解決。我們手動搜索了所有包含文章的參考文獻目錄中的荟萃分析和評論,以確定可能被忽略的研究。
資格標準
我們將飲食糖消耗識別為總糖攝入量和總糖的一部分(單醣、雙醣、多元醇、游離糖或添加糖)的消耗,其以絕對量或作為總能量的百分比表達,或者糖甜飲料或食品(表1)。3 我們納入了對人類進行的不受急性或慢性疾病影響的系統性評論和荟萃分析,包括隨機對照試驗、隊列研究、病例對照研究或橫斷面研究,評估飲食糖消耗。當它們通過相對危險、勝算比、危險比、加權均值差異或標準化均值差異比較了不同的飲食糖消耗對同一健康結果的影響時,荟萃分析有資格納入。當暴露是總糖、單醣、雙醣、多元醇、游離糖、添加糖或糖甜飲料或食品時,我們納入荟萃分析。如果一個研究中報告了兩個或更多的健康結果,我們將分別提取有關個別結果的數據。如果在相同的飲食糖暴露和健康結果上進行了兩個以上的研究,並且在24個月以上的時間內進行了兩個以上的研究,我們將包括最新的研究以進行數據提取,一般是樣本量最大的研究。如果在同一24個月期間進行了多個研究,我們將包括前瞻性研究和隨機對照試驗數量較多的荟萃分析(如果前瞻性研究數量相等,則包括AMSTAR分數較高的研究)。4243 此外,如果最新的研究沒有進行劑量反應分析,而另一個研究進行了,我們將包括兩個研究進行數據提取。
這些傘審的排除標準包括碳水化合物、非營養甜味劑和人工甜味飲料與健康結果之間的關聯的荟萃分析;評估短期糖補充的治療或代謝效果的荟萃分析;評估特定疾病人群飲食糖消耗對健康結果的影響的荟萃分析;旨在實現將糖與其他形式的碳水化合物進行同等能量替代的隨機對照試驗;缺乏評估來自含糖食品的糖消耗的數據的研究(如蜂蜜、蘋果、巧克力、冰淇淋、100%水果汁);以及非英語研究和動物和細胞培養研究。
數據提取
兩位審查者(YH和ZYC)獨立從每個符合標準的研究中提取以下信息:第一作者的姓名、發表年份、飲食糖消耗類型(總糖、單醣、雙醣、多元醇、游離糖、添加糖、含糖飲料或食品)、飲食糖消耗的測量、健康結果、納入研究的數量、病例數和總參與者數、研究設計(橫斷面、病例對照、隊列和隨機對照試驗)、比較(高對低、從不/低對中等/高、有對無,或每天(或每週)額外增加的糖量與無)、以及估計的綜合效應(風險比、勝算比、加權均值差異和標準化均值差異及95%置信區間)。此外,我們還提取了效應模型(隨機和固定)、異質性(I2統計和Cochran’s Q檢驗P值)、以及出版偏差評估(Egger’s檢驗或漏斗圖的P值)。如果進行了劑量反應分析和亞組分析,我們還提取了非線性測試的P值和荟萃分析中亞組分析的結果。如果一個荟萃分析同時針對隊列和病例對照/橫斷面研究進行了,並且通過研究設計進行了分層分析,我們選擇了隊列設計的次分析結果進行數據提取或重新分析。任何分歧由第三位作者(LRL)確定。
方法和證據的質量評估
兩位審查者(YH和ZYC)使用AMSTAR(系統性評論評估的測量工具)評估了納入文章的方法學質量,這是一個在評估系統性評論和荟萃分析質量方面具有有效性和可靠性的測量工具。此外,根據建議、評估、發展和評價(GRADE)的分級,我們評估了每個健康結果的證據並將其分為“高”、“中”、“低”或“非常低”的質量以得出結論。此外,我們按照證據分類準則將結果的證據分為四類:I類(有說服力的證據)、II類(高度提示的證據)、III類(提示性證據)、IV類(薄弱證據)和NS(非顯著)。表2顯示了證據分類的詳細標準。
表2 證據分類標準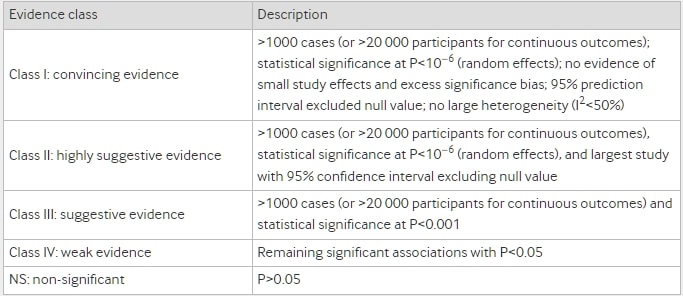
數據分析
我們通過隨機或固定效應模型重新分析了風險比、勝算比、加權均值差異或標準化均值差異及95%置信區間,並計算了異質性的I2統計、Cochran’s Q檢驗的P值以及Egger’s迴歸檢驗的P值(至少包含10個研究)以評估每個包含的荟萃分析中報告的指標、納入的原始研究的病例數和參與者數。對於分類為I或II級的結果,如果有足夠的數據可用於評估在排除一些組成研究時證據的可信度是否變化,我們進行了敏感性分析。我們還從包含的荟萃分析中提取了飲食糖消耗與各種健康結果之間的劑量-反應關聯,如果有的話。此外,如果最新的荟萃分析未包含其他荟萃分析所包含的原始文章,我們將這些荟萃分析的數據組合在一起進行重新分析。我們使用Cohen’s κ統計量和相應的95%置信區間評估了兩位作者(YH和ZYC)在研究選擇方面的一致性。我們根據Landis和Koch報告的指南解釋了一致性的大小:微弱(0.00-0.20)、一般(0.21-0.40)、中度(0.41-0.60)、顯著(0.61-0.80)和幾乎完全一致(0.81-1.00)。此外,如果一個荟萃分析報告了將觀察性研究與隨機對照試驗結合後的估計效應,我們將分別重新分析觀察性研究和隨機對照試驗的估計效應。如果我們無法從一個荟萃分析中進行重新分析,我們將盡可能提取摘要數據並評估異質性和出版偏差。我們將P值 <0.10視為異質性檢驗的統計顯著性水平。對於其他測試,我們將P值 <0.05視為顯著。我們使用Review Manager版本5.3進行證據綜合、Stata版本12.1進行Egger’s檢驗和敏感性分析,以及IBM SPSS Statistics版本25進行Cohen’s κ統計量。
患者和公眾參與
患者和公眾未參與該研究的計劃、設計和實施,因為該研究使用了次級數據。未有患者被要求就解釋或撰寫手稿進行咨詢。
結果
荟萃分析的特點
圖1顯示了文獻搜索和選擇過程的流程圖。經過系統性的文獻搜索,我們識別了8601篇獨特的文章。根據我們的納入標準,共識別出73個荟萃分析,包括67個觀察性研究的荟萃分析和6個隨機對照試驗的荟萃分析。兩位審查者(YH和ZYC)在研究選擇方面的一致性幾乎完美(κ=0.906,95%置信區間0.859至0.953;P<0.001)。我們從觀察性研究的荟萃分析中提取了74個獨特的結果,從隨機對照試驗的荟萃分析中提取了9個獨特的結果。隨機對照試驗的荟萃分析僅包括體重變化(含糖飲料)、肝脂肪積聚、肌肉脂肪積聚、身體質量指數變化、體重變化(果糖)、進食後三酸甘油酯、血清尿酸、肝細胞內脂質、以及丙氨酸氨基轉移酶。圖2顯示了飲食糖消耗與多種健康結果之間的顯著劑量-反應關係。其他森林圖表顯示了飲食糖消耗與內分泌/代謝(圖3)、心血管(圖4)、癌症(圖5)以及其他結果(圖6)之間的顯著非劑量-反應關係。每個結果與飲食糖消耗之間的關聯的完整版本顯示在補充表A-D中。
圖1 系統性搜索和選擇過程的流程圖 圖2 飲食糖消耗與多種健康結果之間的顯著劑量-反應關係。估計值為相對風險,總均值差異為加權均值差異,效應模型為隨機模型,除非另有說明。Δ=最終值-基線值;AMSTAR=系統性評論評估的測量工具;C=隊列研究;CHD=冠心病;CI=置信區間;CVD=心血管疾病;GRADE=建議評估、發展和評價的分級;NA=無法獲得;P=以人群為基礎的病例對照和/或橫斷面研究;SSB=含糖飲料;T=總研究數;T2DM=2型糖尿病。*每週增加1份量。†每日增加355毫升。‡每日增加250毫升。§每日增加1份量。¶每日增加25克。**危險比。†兒童 圖3 飲食糖消耗與內分泌和代謝結果之間的顯著非劑量-反應關係。比較為最高與最低,估計值為相對風險,總均值差異為加權均值差異,效應模型為隨機模型,除非另有說明。飲食糖消耗與內分泌和代謝結果之間的完整關聯顯示在補充表A中。Δ=最終值-基線值;AMSTAR=系統性評論評估的測量工具;C=隊列研究;CI=置信區間;GRADE=建議評估、發展和評價的分級;HDL-C=高密度脂蛋白膽固醇;LADA=成年人潛在自體免疫性糖尿病;LDL-C=低密度脂蛋白膽固醇;NA=無法獲得;P=以人群為基礎的病例對照和/或橫斷面研究;R=隨機對照試驗;SSB=含糖飲料;T=總研究數。*勝算比。†兒童。‡有對無。§固定效應模型。¶標準化均值差異 圖4 飲食糖消耗與心血管結果之間的顯著非劑量-反應關係。比較為最高與最低,估計值為相對風險,總均值差異為加權均值差異,效應模型為隨機模型,除非另有說明。飲食糖消耗與心血管結果之間的完整關聯顯示在補充表B中。Δ=最終值-基線值;AMSTAR=系統性評論評估的測量工具;C=隊列研究;CI=置信區間;CVD=心血管疾病;GRADE=建議評估、發展和評價的分級;NA=無法獲得;P=以人群為基礎的病例對照和/或橫斷面研究;SBP=收縮壓;SSB=含糖飲料;T=總研究數。*兒童和青少年。†勝算比 圖5 飲食糖消耗與癌症結果之間的顯著非劑量-反應關係。比較為最高與最低,估計值為相對風險,效應模型為隨機模型,除非另有說明。飲食糖消耗與癌症結果之間的完整關聯顯示在補充表C中。AMSTAR=系統性評論評估的測量工具;GRADE=建議評估、發展和評價的分級;C=隊列研究;CI=置信區間;NA=無法獲得;P=以人群為基礎的病例對照和/或橫斷面研究;SSB=含糖飲料;T=總研究數 圖6 飲食糖消耗與其他結果之間的顯著非劑量-反應關係。比較為最高與最低,估計值為相對風險,總均值差異為加權均值差異,效應模型為隨機模型,除非另有說明。飲食糖消耗與其他結果之間的完整關聯顯示在補充表D中。ADHD=注意缺陷/多動症;AMSTAR=系統性評論評估的測量工具;BMD=骨密度;C=隊列研究;CI=置信區間;GRADE=建議評估、發展和評價的分級;IHCL=肝細胞內脂;NA=無法獲得;NAFLD=非酒精性脂肪性肝病;P=以人群為基礎的病例對照和/或橫斷面研究;R=隨機對照試驗;SSB=含糖飲料;T=總研究數。*兒童。†勝算比。‡固定效應模型。§從不/低消耗對中等/高消耗。¶標準化均值差異。**有對無。
大多數包含的荟萃分析聚焦於飲食糖消耗與內分泌/代謝性疾病之間的關聯(n=28),其次是癌症(n=25)、心血管疾病(n=17)、神經精神疾病(n=3)、牙齒疾病(n=2)和其他疾病(n=8)(見圖7)。飲食糖暴露包括含糖飲料(n=58)、果糖(n=11)、蔗糖(n=4)、乳糖(n=1)、添加糖(n=4)、游離糖(n=1)和總糖(n=4)。有45個有害關聯和四個有益關聯達到了顯著性。其餘34個結果在有害或有益關聯上但未達到顯著性。經過GRADE和證據分類標準對證據的質量進行評估後,大多數的83個結果被歸類為“低”或“非常低”質量和III、IV或NS證據級別。只有四個(5%)內分泌/代謝結果被分類為“中等”質量。三個(4%)內分泌/代謝結果、兩個(2%)心血管結果和三個(4%)其他結果被評為IIB級。在這個統籌回顧中沒有發現“高”質量或I級證據。
圖7 與飲食糖消耗相關的結果地圖
內分泌和代謝結果
低和中等質量證據
一項涵蓋六項隨機對照試驗的荟萃分析發現,含糖飲料消耗與最高與最低消耗相比體重增加顯著相關(加權均值差異0.85,95%置信區間0.50至1.20)(中等;IV(證據質量表現為“GRADE,證據類”))。此外,任何添加糖消耗與增加的肝脂肪積聚(標準化均值差異0.93,95%置信區間0.64至1.21)(中等;IV)和肌肉脂肪積聚(標準化均值差異0.63,0.23至1.04)(中等;IV)有關。另一項劑量反應荟萃分析顯示,人工甜味飲料每週增加一份與痛風風險增加4%有關(風險比1.04,95%置信區間1.02至1.07)(低;III)。此外,比較高含糖飲料消耗與非含糖飲料消耗顯示,與較高消耗相關的兒童肥胖風險增加55%(勝算比1.55,95%置信區間1.32至1.82)(低;II)。含糖飲料消耗還與兒童體重指數增加有關。作者進行了劑量反應分析,顯示每天喝含糖飲料每增加一份,兒童的體重指數增加0.07單位(加權均值差異0.07,0.01至0.12)(低;IV)。這個統籌回顧的證據表明,果糖攝入量與血清尿酸(中等;NS)或體重變化(低;NS)無關(圖2;圖3)。
非常低質量證據
基於七個隊列研究的劑量反應分析顯示,每天喝一份含糖飲料與一年增加0.22公斤體重有關(加權均值差異0.22,0.09至0.34)。此外,最高與最低含糖飲料消耗相比,痛風風險增加35%(風險比1.35,1.18至1.55)。最高與最低含糖飲料消耗也與高尿酸血症風險增加35%(風險比1.35,1.19至1.52)有顯著關聯。此外,另一項合併分析發現,最高含糖飲料消耗者的血清尿酸濃度比最低消耗者高0.18毫克/分升(加權均值差異0.18,0.11至0.25)。同樣,最高果糖攝入也可能增加痛風(風險比1.62,1.28至2.03)和高尿酸血症(勝算比1.85,1.66至2.07)的風險,與最低消耗相比。
最近的荟萃分析發現,最高與最低含糖飲料消耗相比,高密度脂蛋白膽固醇降低了1.46毫克/分升(加權均值差異-1.46,-2.25至-0.67)。亞組分析顯示,在美國進行的研究中,最高與最低含糖飲料消耗相比,高密度脂蛋白膽固醇較低(加權均值差異-2.85,-4.09至-1.61),但在歐洲/大洋洲進行的研究中高密度脂蛋白膽固醇較高(加權均值差異1.65,0.26至3.05)。最高與最低含糖飲料消耗還與低密度脂蛋白膽固醇增加(加權均值差異1.21,0.23至2.20)和總膽固醇降低(-2.49,-2.89至-2.10)有顯著關聯。在地區分層後,無法檢測到含糖飲料消耗與低密度脂蛋白膽固醇的顯著關聯性,在美國,歐洲/大洋洲和亞洲進行的研究中都是如此,而最高與最低含糖飲料消耗與低總膽固醇濃度相關聯的研究在美國/歐洲進行,而在亞洲進行的研究中則未發現(加權均值差異-2.47,-2.88至-2.07)。
每天喝355毫升含糖飲料的風險增加14%(風險比1.14,1.05至1.23),沒有證據表明與線性偏離有關。此外,一項涵蓋56,579名參與者和11,821例肥胖發病的荟萃分析顯示,含糖飲料消耗與肥胖風險存在不良的線性劑量-反應關係。每增加250毫升/天的含糖飲料消耗與肥胖風險增加12%(風險比1.12,1.05至1.19),並且即使調整了能量攝入(1.13,1.09至1.18)和身體活動(1.14,1.05至1.25),這種關聯性也仍然存在。此外,一項涵蓋16項隊列研究的荟萃分析發現,每增加一份/天含糖飲料消耗,罹患2型糖尿病的風險增加27%(風險比1.27,1.15至1.41)。相反,根據六項隊列研究進行的劑量反應分析,每增加25克/天蔗糖攝入量,2型糖尿病的風險降低8%(風險比0.92,0.85至0.99)。最高與最低含糖飲料消耗還與成人潛在自體免疫性糖尿病風險增加(勝算比1.26,1.12至1.41)有顯著關聯(圖2;圖3)。
我們未發現含糖飲料消耗與成人體重指數的變化、三酸甘油脂或腰圍增大之間存在顯著關聯。果糖攝入與餐後三酸甘油脂或2型糖尿病無關。總糖攝入量也與2型糖尿病無關(參見附表A)。
心血管結果
低質量證據
在一篇文章中,觀察到含糖飲料消耗與冠心病風險之間存在正相關。劑量反應分析顯示,每增加250毫升/天的含糖飲料消耗與17%(風險比1.17,1.11至1.23)較高的冠心病風險呈正相關(低;II)。此外,極端分類分析顯示,最高與最低含糖飲料消耗相比,與心肌梗塞風險增加相關(風險比1.19,1.09至1.31)(低;III)。低質量證據表明,果糖攝入與高血壓風險無關(低;NS)(圖2;圖4)。
非常低質量證據
除了蔗糖攝入與心血管疾病死亡之間的有益關聯外,所有類別的飲食糖暴露均與各種心血管結果不利相關。最近的劑量反應荟萃分析顯示,每增加250毫升/天的含糖飲料消耗與7%(風險比1.07,1.02至1.12)較高的中風風險呈正相關。另一項涵蓋329,791名參與者和16,999例案例的七項隊列研究的荟萃分析發現,每增加一份/天的含糖飲料消耗與8%(風險比1.08,1.02至1.14)較高的心血管疾病風險呈線性相關。對於心血管疾病死亡,每增加一份/天的含糖飲料消耗也與較高的風險呈線性相關(危險比1.08,1.04至1.12)。然而,亞組分析發現,含糖飲料消耗與心血管疾病死亡之間的關聯在亞洲參與者中並不具有統計學意義。在一個獨立的兒童和青少年荟萃分析中,最高與最低含糖飲料消耗被證實與收縮壓增加1.67毫米汞柱(加權均值差異1.67,1.02至2.32)和高血壓風險增加36%(勝算比1.36,1.14至1.63)有關。在成年人中,來自13個前瞻性隊列研究的集合分析結果顯示,含糖飲料消耗與高血壓發病存在不良的劑量-反應關聯。每增加355毫升/天(1份/天)的含糖飲料消耗使高血壓風險增加11%(風險比1.11,1.09至1.13)。此外,果糖(風險比1.08,1.01至1.15)和總糖(風險比1.09,1.02至1.17)均與最高與最低消耗相比的心血管疾病死亡風險相關,而蔗糖攝入與心血管疾病死亡之間存在有益關聯(圖2;圖4)。
我們未觀察到含糖飲料消耗與舒張壓的變化(兒童和青少年)或心衰之間存在顯著關聯。我們還未觀察到蔗糖攝入或總糖攝入與心血管疾病風險之間存在顯著關聯。此外,添加糖攝入與心血管疾病死亡風險無關(參見附表B)。
癌症
低質量證據
一項劑量反應的荟萃分析顯示,與最低含糖飲料消耗相比,最高含糖飲料消耗會使肝細胞癌風險增加100%(風險比2.00,1.33至3.03)(低;IV)。此外,Aune等人進行的一項荟萃分析發現,每天攝入25克的果糖與胰臟癌風險呈線性相關,風險增加了22%(風險比1.22,1.08至1.37)(低;III)。在調整了吸煙、身體質量指數、紅肉和加工肉消耗以及能量攝入的研究子組中,果糖攝入與胰臟癌發病率的關聯仍然顯著,而在調整了酒精攝入、糖尿病狀況或體育活動的研究子組中,這種關聯則減弱(圖2;圖5)。
非常低質量證據
最近一項包括六個觀察性研究的荟萃分析顯示,最高與最低含糖飲料消耗相比,乳腺癌風險較高(風險比1.14,1.01至1.30)。在另一個荟萃分析中,Li等人發現,最高含糖飲料消耗可能使乳腺癌死亡風險增加17%(風險比1.17,1.03至1.34),與最低含糖飲料消耗相比。此外,一項涵蓋六個隊列研究的荟萃分析發現,最高含糖飲料消耗的參與者患前列腺癌的風險比最低消耗者更高(風險比1.17,1.07至1.28)。劑量反應分析未檢測到顯著關聯。然而,在我們的總體回顧中,我們觀察到含糖飲料消耗與神經膠腫之間存在保護性關聯(風險比0.81,0.66至0.99)。此外,一項涵蓋550,5812名參與者的20個隊列研究的荟萃分析觀察到含糖飲料消耗與整體癌症風險之間的正線性劑量-反應關係。每增加一份/天的含糖飲料消耗,風險增加4%(風險比1.04,1.01至1.09)。此外,涵蓋1,239,183名參與者的10個隊列研究的集合分析發現,最高與最低含糖飲料消耗相比,明顯與整體癌症死亡風險增加相關(風險比1.06,1.00至1.12),但沒有顯著的劑量-反應關係。區域分層產生了含糖飲料消耗與北美人口整體癌症死亡之間的正相關(勝算比1.08,1.01至1.15),但在亞洲地區不具有統計學意義(0.99,0.81至1.22)(圖2;圖5)。
我們觀察到含糖飲料消耗與膽道癌、膀胱癌、結腸癌、直腸癌、結腸直腸癌死亡、子宮內膜癌、食道癌、胃癌、血液恶性腫瘤、腎癌、肺癌死亡、鼻咽癌、胰腺癌和前列腺癌死亡風險之間不存在顯著關聯。此外,添加糖攝入與結腸癌的風險無關。我們未觀察到蔗糖攝入與胰腺癌之間存在顯著關聯。此外,乳糖攝入與卵巢癌的風險無關(見附表C)。
其他結果
低質量證據
最近一項包括11個隊列研究的荟萃分析顯示,每天飲用250毫升含糖飲料的增加與全因死亡風險增加4%(危險比1.04,1.02至1.06)相關(低;III)。此外,一項涵蓋10個觀察研究的荟萃分析觀察到含糖飲料消耗與抑鬱風險之間存在有害關聯(風險比1.31,1.24至1.39)(低;II)。果糖攝入與丙氨酸氨基轉移酶濃度之間未觀察到顯著關聯(低;NS)(見圖2;圖6)。
非常低質量證據
最高與最低含糖飲料消耗可能使兒童患哮喘的風險增加26%(勝算比1.26,1.07至1.48)。在一篇單獨的文章中,含糖飲料消耗(勝算比1.80,1.23至2.63)和總糖攝入量(1.22,1.04至1.42)均與注意力缺陷/多動症風險增加有關。此外,一項包括10個觀察研究的荟萃分析結果顯示,含糖飲料消耗與成人骨密度存在顯著的負相關(標準化均值差異−0.66,−1.01至−0.31)。按性別進行的亞組分析顯示,含糖飲料消耗對女性骨密度存在顯著的有害影響(標準化均值差異−0.50,−0.87至−0.13),但男性則不存在相關。對於口腔疾病,一篇單獨的文章發現含糖飲料消耗與龋齒發生率(勝算比1.72,1.41至2.09)和牙齒侵蝕(1.77,1.28至2.43)之間存在有害關聯,比較從不/少量飲用與中等/高量飲用。此外,含糖飲料消耗與非酒精性脂肪肝風險呈正相關(風險比1.39,1.29至1.50)。果糖攝入與肝細胞內脂肪增加相關(標準化均值差異0.45,0.18至0.72)(見圖2;圖6)。
含糖飲料消耗與慢性腎臟疾病風險無關。此外,孕期母親自由糖攝入量的增加與後代患哮喘的風險無關(見附表D)。
異質性
我們對69%的所有健康結果進行了隨機或固定效應模型的重新分析。重新分析發現,我們重新分析的健康結果中約有46%存在顯著異質性(I2>50%或Cochran’s Q檢驗的P值<0.1)。大多數結果的異質性可以通過一些潛在因素解釋,包括設置、地區、種族、性別、年齡、研究質量、研究設計、樣本大小、隨訪時間以及對混雜因素的調整。在我們無法重新分析的26個結果中,約有54%存在顯著異質性,4%未報告異質性評估結果。
風險偏差評估
我們對我們重新分析的23%的結果進行了Egger’s檢驗,發現有3個結果存在發表偏差的證據,分別是2型糖尿病(含糖飲料)(P=0.016)、整體癌症風險(P=0.005)以及成人高血壓(含糖飲料)(P=0.02)。對於我們無法重新分析的結果,通過統計檢驗或漏斗圖檢測到了心血管疾病死亡(含糖飲料)、非酒精性脂肪肝、成人肥胖和體重變化(一年)的發表偏差。其餘結果未顯示顯著的發表偏差或未報告發表偏差評估。
AMSTAR、GRADE和證據分類
所有健康結果的AMSTAR得分中位數為8(範圍3-11;四分位範圍8-9.25)。附錄E提供了每個結果的詳細AMSTAR得分。由於觀察性研究設計和質量下降因素(顯著的偏差風險、不一致性、間接性、不確定性和可能的發表偏差),所有來自隊列研究、以人群為基礎的病例對照研究和橫斷面研究的證據均被評為“低”或“非常低”質量。在九個隨機對照試驗的荟萃分析中,四個(肝脂肪積聚、肌肉脂肪積聚、血清尿酸(果糖)和體重變化(含糖飲料))由於不確定性被降級為“中等”質量,其餘(丙氨酸氨基轉移酶、肝細胞內脂肪、飯後三酸甘油酯、成人體重指數變化和體重變化(果糖))由於偏差風險、不一致性、間接性或不確定性而被降級為“低”或“非常低”質量。附錄E顯示了每個結果的詳細GRADE分類。就證據分類而言,2型糖尿病(含糖飲料)、高尿酸血症(果糖)、兒童肥胖(含糖飲料)、冠心病、成人高血壓(含糖飲料)、龋齒、抑鬱症和非酒精性脂肪肝被分類為II類。對於其餘75個結果,有15個(18.1%)被分類為III類,有26個(31.3%)被分類為IV類,有34個(41.0%)被確定為非顯著(附錄E)。對於每個被分類為II類的結果的敏感性分析未改變關聯的方向或顯著性。
討論
主要發現和可能的解釋
飲食中的糖攝取與多種健康結果之間存在有害聯繫,包括高與低、從不/低與中等/高、任何與無、或每天(或每週)額外攝取的糖量與無之間的增量。我們確定了73個荟萃分析和83個健康結果,來自8601篇獨特的文章,其中包括74個觀察性研究荟萃分析中的獨特結果和9個隨機對照試驗荟萃分析中的獨特結果。
飲食中的糖攝取與內分泌和代謝結果之間存在有害聯繫,包括兒童體重指數的變化、體重的變化、體重的變化(一年)、痛風、高密度脂蛋白膽固醇、高尿酸血症、成人潛在自體免疫性糖尿病、低密度脂蛋白膽固醇、代謝綜合徵、兒童肥胖、成人肥胖、血清尿酸、2型糖尿病、肝脂肪積聚和肌肉脂肪積聚。此外,飲食中的糖攝取與心血管結果之間也存在有害聯繫,包括冠心病、心血管疾病、心血管疾病死亡、兒童和青少年高血壓、成人高血壓、心肌梗死、兒童和青少年收縮壓變化以及中風。飲食中的糖攝取與多種癌症風險之間存在顯著有害聯繫,包括乳腺癌、乳腺癌死亡、肝細胞癌、攝入糖量與胰臟癌風險、整體癌症風險以及整體癌症死亡。最後,飲食中的糖攝取也與全因死亡、兒童哮喘、注意力缺陷/過動症、骨密度、牙齒蛀牙、牙齒侵蝕、抑鬱症、非酒精性脂肪肝以及肝細胞內脂肪存在有害聯繫。
一般來說,沒有可靠的證據表明飲食中的糖攝取與任何健康結果存在有益聯繫,除了膠質瘤(含糖飲料)、總膽固醇(含糖飲料)、2型糖尿病(蔗糖)以及心血管疾病死亡(蔗糖)。然而,這些有利聯繫並不得到有力證據的支持,對於這些結果的解釋應該謹慎進行。對於膠質瘤風險降低,這一證據僅來自於兩個隊列研究,且沒有研究表明含糖飲料的攝取是降低癌症發病率的保護因子。高含糖飲料攝取與較低的總膽固醇濃度相關。然而,亞組分析顯示,含糖飲料攝取與總膽固醇濃度在含糖飲料攝取量>750克/天的研究以及涉及青少年的研究中相關。因此,潛在的混雜因素,包括地區、含糖飲料劑量、樣本量和性別,在解釋含糖飲料攝取與總膽固醇濃度之間的關係時應該予以考慮。對於蔗糖攝取對2型糖尿病和心血管疾病死亡的保護作用,我們注意到蔗糖更多地存在於固體食物中,而不是含糖飲料,包括穀物和穀物制品、水果和果制品以及含糖乳制品和乳制品。這些蔗糖的主要來源顯示出與2型糖尿病和心血管疾病死亡的有益聯繫。因此,蔗糖攝取與2型糖尿病和心血管疾病死亡之間的保護聯繫可能反映了這些其他食物來源的重要貢獻,而不是蔗糖本身。進一步的大規模前瞻性研究有必要評估蔗糖攝入量與2型糖尿病和心血管疾病死亡的關聯,並澄清可能的潛在機制。
我們的綜合評價顯示,飲食中的糖攝取與一系列心臟代謝性疾病存在有害聯繫,特別是體重增加、異位脂肪積聚、肥胖和心血管疾病,這主要歸因於過度攝入含果糖的糖。對於大碳水化合物攝入的反應,果糖可能通過誘導肝臟主要轉錄因子來增強肝臟脂肪合成能力。此外,一項動物研究發現,飲食中的果糖可以被腸道微生物轉化為乙酸,這可能通過為脂肪合成提供脂肪性乙酰輔酶獨立於ATP檸檬酸裂解酶來增強肝臟脂肪合成。在這個過程中生成的中間產物,如二酰甘油,可能會在肝臟和外周組織中損害胰島素信號傳導,進而導致胰島素抵抗。隨後,可能會促使肝臟和肌肉中的異位脂肪沉積。飲食中的果糖還可能通過減少靜息能量消耗並促進瘦素耐受性來誘導肥胖的發生。此外,與固體食物相比,含相同熱量的含糖飲料與較低的飽腹感相關,這可能會刺激食慾並長期內食入過多卡路里,進而導致肝臟脂肪積聚和胰島素抵抗。這一假設得到了在健康成人中進行的幾項臨床試驗的證實,這些試驗發現與人工甜味飲料相比,含糖飲料的攝取會導致更多的卡路里攝入和體重增加。此外,一項最近的雙盲、隨機對照試驗在94名健康男性中進行,結果顯示攝入含果糖的含糖飲料可能會顯著改變低密度脂蛋白顆粒的分佈,使其向較小、更具動脈粥樣變性的顆粒轉變,從而部分調節了含糖飲料攝取與血脂異常和心血管疾病的關聯。
解釋飲食中的糖攝取與心臟代謝性疾病之間的聯繫的另一個重要機制涉及尿酸合成。許多研究證實,過度的果糖攝入可以通過誘導ATP降解為AMP來促進尿酸合成。此外,果糖誘導的高胰島素血症和胰島素抵抗也可能通過降低尿酸的排泄來導致較高的血清尿酸。高尿酸血症是痛風的前驅。高尿酸血症與高血壓、2型糖尿病和心血管疾病等心臟代謝性疾病的正面聯繫已經被提出很長一段時間。高尿酸血症已被證明在2型糖尿病和肥胖發生之前。從機制上講,高尿酸血症可能誘導腎小血管變化、慢性鈉滯留、血管內皮細胞中一氧化氮濃度降低以及腎素-血管緊張素系統的活化,這可能解釋了含果糖的糖攝取與心血管疾病之間的關聯。到目前為止,飲食中的糖攝取與癌症風險之間的證據仍然有限且存在爭議。在2018年,世界癌症研究基金會/美國癌症研究所(WCRF/AICR)報告指出,有關糖的攝取和含糖食物與結腸癌風險之間的聯繫的證據有限。然而,與此同時,該報告建議減少或避免含糖飲料的攝取以預防乳腺癌。我們的綜合評價部分支持了WCRF/AICR的建議。在我們的研究中,雖然25個癌症結果中有8個被確定與飲食中的糖攝取呈正相關(七個暴露因素是含糖飲料,一個是果糖),但只有肝細胞癌(含糖飲料)和胰臟癌(果糖)的證據被評為“低”質量,因為效應量或劑量-反應梯度,其餘結果均被評為“非常低”質量。因此,在解釋飲食中的糖攝取與某些癌症風險之間的顯著聯繫時,應該謹慎進行。
飲食中的糖對肥胖的影響可能部分解釋了它們與癌症風險之間的聯繫。如前所述,飲食中的糖攝取,尤其是含糖飲料的攝取,與肥胖體重增加有顯著關聯,而這又被認為是各種癌症的強大風險因素。另一個調節飲食中的糖攝取與癌症風險之間聯繫的途徑可能涉及高血糖指數或血糖負荷。高血糖指數已與2型糖尿病的風險有關,而這可能參與了乳腺、前列腺、肝臟、膀胱和子宮內膜的癌症形成。此外,過量果糖攝入可能導致腸道菌群紊亂和腸道屏障惡化,進而促進代謝性內毒素、發炎和脂肪積聚的發展,最終導致結腸癌形成。一項最近的動物研究表明,高果糖玉米糖漿攝入可以通過加速糖酵解和新生脂肪合成來促進小鼠腸道腫瘤形成。接受糖漿治療的小鼠的腫瘤大小和腫瘤等級都顯著增加,與肥胖和代謝綜合征無關。考慮到特定部位的癌症的不同機制,進一步的前瞻性研究對於探討不同癌症類型和族裔群體之間糖攝取與癌症風險之間的確定聯繫是必要的。
另一方面,飲食中的糖攝取還被證明與一些神經精神疾病呈負相關,例如抑鬱症和注意力缺陷/過動症。可能涉及到一些生物學機制。來自一項動物研究的數據表明,高果糖飲食可能會改變雄性維斯塔大鼠的行為、下視丘-垂體-腎上腺軸功能和下視丘轉錄組,誘導焦慮樣行為和抑鬱樣行為。此外,糖攝取已被認為可以刺激核心呼叫束中內源性阿片類物質的分泌並刺激多巴胺的獎勵系統。動物模型中對糖依賴性的證據表明,與吗啡和可卡因的成癮相似,間歇攝入糖的大鼠在核心呼叫束中的多巴胺D2受體mRNA濃度下降,表現出稱為糖依賴的成癮樣行為特徵。此外,飲食中的糖攝取對骨密度的負面影響可能歸因於高糖攝取導致尿鈣的增加和鈣的失衡。除了糖的負面影響外,含糖飲料中含有的磷、酸度和咖啡因是影響骨代謝的另外三個主要因素。我們注意到,關於含糖飲料與骨密度之間的聯繫,根據性別進行的分層分析顯示含糖飲料對女性的骨密度有顯著的有害影響,但對男性的影響不明顯。這些多樣化的發現表明,含糖飲料對女性骨健康的不良影響可能比對男性骨健康的影響更大,因為女性通常骨骼較小、骨強度較低,因此更容易患骨質疏鬆症。此外,含糖飲料的高酸度也被認為是促進蛀牙和牙齒侵蝕的重要因素。
在進行的次組分析中,按地區劃分是最值得注意的,因為一些健康結果顯示出區域性差異,包括整體癌症死亡率、高密度脂蛋白膽固醇、低密度脂蛋白膽固醇和總膽固醇。造成這些差異的潛在原因可能包括糖攝取和文化的區域差異。根據2010年對187個國家的糖飲料消費量的全球、區域和國家水平的量化報告,亞洲國家的消費量低於歐洲和美洲國家。糖飲料在加勒比地區的消費量最高,在東亞和大洋洲地區最低。此外,文化因素已被證明可能通過影響食物偏好或選擇來導致不同的飲食質量和健康不平等。地區文化多樣性在生活方式和社會人口統計學因素方面也起著重要作用,這在一定程度上可以解釋不同族裔群體之間的糖攝取與疾病風險之間的不同關係。另一方面,應該考慮到調整混雜因素的次組分析。高糖攝入,尤其是含糖飲料攝入,可能是一種不健康飲食和生活方式的標誌。攝入含糖飲料更頻繁的人可能會攝入更多的總和飽和脂肪、碳水化合物和鈉,攝入較少的水果、纖維、乳制品和全穀食物。這種飲食模式還與更頻繁的吸煙和飲酒、較低的身體活動水平以及更多時間看電視有關。因此,在解釋糖攝取與疾病負擔之間的聯繫時應該考慮到這些混雜因素的作用。
研究的優點和缺點以及與其他研究的關係
研究的優點和缺點以及與其他研究的關係
本綜述首次全面總結了以前觀察性研究和隨機對照試驗的元分析的目前證據,探討了飲食中糖攝取與所有健康結果之間的關聯。鑒於全球範圍內的高糖攝入水平,本研究對於制定預防過量糖攝取的策略,尤其是針對兒童和青少年,具有臨床和社會意義。本研究是基於系統方法進行的,其中包括兩位作者獨立進行文獻搜索、研究選擇和數據提取。如果數據充分,我們通過隨機或固定效應模型評估了每個包含的元分析的風險比、勝算比、加權均差或標準化均差,並評估了異質性和出版偏差。此外,我們使用了三種標準方法,即AMSTAR、GRADE和證據分類標準,來評估每個健康結果的方法學質量(AMSTAR)、證據強度(GRADE)和分類(證據分類標準),以評估我們對估計的信心。有趣的是,在我們的綜述中,幾個健康結果的GRADE評級與證據分類結果不完全一致。據我們所知,證據分類標準是一個完全客觀的分類標準,而GRADE評級具有一定程度的主觀性。因此,在評估證據並提出建議時,應考慮到GRADE評級和證據分類標準。
包含在元分析中的原始研究使用了不同的飲食調查方法,包括飲食記錄、24小時飲食回顧、飲食頻率問卷和飲食史。即使使用了經過驗證的方法,所有這些方法都與不可避免的測量偏差有關。此限制是全球範圍內在這一領域進行的所有主要流行病學研究的共同特點。此外,大多數研究都專注於購買前甜味飲料。例如,在護士健康研究中,帶糖的咖啡被排除在含糖飲料之外,這可能影響了關聯的可靠性。同樣,我們研究的另一個限制是,我們無法評估一些可能含有糖的食品的糖攝入量,例如巧克力和冰淇淋,因為無法提取有關糖攝取的數據。此外,原始研究中含糖飲料的類型和用量各異。在這個綜述中,大多數元分析的摘要效應來自於原始研究,這些原始研究通過每日飲用的份數來測量飲食中糖的攝入量。然而,在
一些原始研究中,使用了每日毫升數、每日克數、每日次數、每周次數、每月次數、每周份數或每月份數來估計糖攝入量,這可能在一定程度上解釋了元分析中異質性的來源。因此,由於原始研究中對含糖飲料攝取量的測量方式各異,對大多數結果進行劑量-反應分析和按照含糖飲料類型進行分層分析是不可用的。含糖飲料中的糖攝入通常伴隨著一些其他化學化合物的攝入,例如4-甲基咪唑、農藥、人造甜味劑、苯甲酸鈉和亞硫酸鹽,這些可能混淆了糖的效應,因此應被視為潛在的混雜因素。
我們查閱了包含在本綜述中的元分析中的利益衝突和資助披露的詳細信息。只有兩個元分析是由生產含糖飲料的公司資助的。其中一個是由Wang等人進行的元分析,被選中進行數據提取,並在摘要表中顯示。因此,在解釋果糖攝入量與餐後三酸甘油酯之間的非顯著關聯時,應該謹慎。另一個元分析沒有被選中進行數據提取,並且如有需要,所有未被選中進行數據提取和重新分析的元分析的列表都是可用的。我們沒有調查每個元分析中包含的原始研究,因此無法確定這些研究是否與糖業相關聯的公司存在競爭利益。
我們綜述中觀察到的飲食中糖攝取與多種健康結果之間的有害關聯,得到了近年來發表的幾項大規模前瞻性隊列研究的支持。首先是一項使用法國NutriNet-Santé隊列研究(2009-17年)的結果進行的大型前瞻性隊列研究,該研究包括了101257名參與者,平均年齡為42.2歲。在八年的隨訪期間,共報告了2193例癌症病例,其中包括693例乳腺癌病例。發現飲用含糖飲料與總體癌症風險(危險比1.18,1.10至1.27)和乳腺癌風險(1.22,1.07至1.39)之間存在有害關聯。20在這項研究中觀察到的含糖飲料攝取量與結腸癌風險之間的非顯著關聯,與我們的綜述中觀察到的情況一致。在護士健康研究II中,作者們在1991年至2015年對95,464名婦女進行了前瞻性探討,探究了成人期和青春期飲用含糖飲料與早發結腸癌風險之間的關聯。在隨訪期間確認了109例早期結腸癌病例。與成年期飲用少於一週一次含糖飲料的女性相比,每天飲用兩次或更多的女性結腸癌風險增加了118%(風險比2.18,1.10至4.35)。每天攝入一份含糖飲料與早期結腸癌風險增加了16%(風險比1.16,1.00至1.36)。與他們的發現相似,我們觀察到含糖飲料(添加糖的主要來源之一)攝入量與2型糖尿病的風險之間有著顯著的關聯。
結論和建議
本綜述顯示,高飲食中糖攝取,特別是攝入含果糖的糖,與大量健康結果之間存在有害關聯。對於與體重變化(含糖飲料)、異位脂肪積聚(添加糖)、兒童肥胖(含糖飲料)、冠心病(含糖飲料)和抑鬱(含糖飲料)相關的健康結果,證據似乎比其他結果更可靠。飲食中糖攝取與癌症之間的關聯的證據仍然有限,但值得進一步研究。結合世界衛生組織和WCRF/AICR的建議以及我們的研究結果,我們建議將自由糖或添加糖的攝取量限制在每天不超過25克(約六茶匙),並將含糖飲料的攝取量限制在每週不超過一份(約200-355毫升/週)。為了改變糖的攝取模式,尤其是對兒童和青少年,迫切需要全球範圍內的廣泛公共衛生教育和政策。
在這個話題上已經知道的事情有:
- 糖的攝取可能對健康有負面影響,尤其是導致肥胖、糖尿病、心血管疾病、高尿酸血症、痛風、異位脂肪積聚、牙齒蛀牙和一些癌症等。
- 研究設計的缺陷、不同的測量方法、研究結果不一致以及對暴露的定義不同,使得得出最終結論對於關聯性的確定變得困難。
- 需要對糖攝取與所有健康結果的關聯進行全面評估,以了解現有證據的質量。
這項研究增加了:
- 高飲食中糖的攝取對健康通常更有害而不是有益,尤其是在心腦血管疾病方面。
- 飲食中糖攝取與癌症之間的關聯的證據仍然有限,但值得進一步研究。
- 現有證據主要是觀察性的,質量較低,需要進一步進行隨機對照試驗。
參考資料:
↵Qin P, Li Q, Zhao Y, et al. Sugar and artificially sweetened beverages and risk of obesity, type 2 diabetes mellitus, hypertension, and all-cause mortality: a dose-response meta-analysis of prospective cohort studies. Eur J Epidemiol2020;35:655-71. doi:10.1007/s10654-020-00655-y pmid:32529512CrossRefPubMedGoogle Scholar
↵Ruanpeng D, Thongprayoon C, Cheungpasitporn W, Harindhanavudhi T. Sugar and artificially sweetened beverages linked to obesity: a systematic review and meta-analysis. QJM2017;110:513-20. doi:10.1093/qjmed/hcx068 pmid:28402535CrossRefPubMedGoogle Scholar
↵Te Morenga L, Mallard S, Mann J. Dietary sugars and body weight: systematic review and meta-analyses of randomised controlled trials and cohort studies. BMJ2012;346:e7492. doi:10.1136/bmj.e7492 pmid:23321486Abstract/FREE Full TextGoogle Scholar
↵Malik VS, Popkin BM, Bray GA, Després JP, Willett WC, Hu FB. Sugar-sweetened beverages and risk of metabolic syndrome and type 2 diabetes: a meta-analysis. Diabetes Care2010;33:2477-83. doi:10.2337/dc10-1079 pmid:20693348Abstract/FREE Full TextGoogle Scholar
↵Imamura F, O’Connor L, Ye Z, et al. Consumption of sugar sweetened beverages, artificially sweetened beverages, and fruit juice and incidence of type 2 diabetes: systematic review, meta-analysis, and estimation of population attributable fraction. BMJ2015;351:h3576. doi:10.1136/bmj.h3576 pmid:26199070Abstract/FREE Full TextGoogle Scholar
↵Meng Y, Li S, Khan J, et al. Sugar- and Artificially Sweetened Beverages Consumption Linked to Type 2 Diabetes, Cardiovascular Diseases, and All-Cause Mortality: A Systematic Review and Dose-Response Meta-Analysis of Prospective Cohort Studies. Nutrients2021;13:2636. doi:10.3390/nu13082636 pmid:34444794CrossRefPubMedGoogle Scholar
↵Xi B, Huang Y, Reilly KH, et al. Sugar-sweetened beverages and risk of hypertension and CVD: a dose-response meta-analysis. Br J Nutr2015;113:709-17. doi:10.1017/S0007114514004383 pmid:25735740CrossRefPubMedGoogle Scholar
↵Yin J, Zhu Y, Malik V, et al. Intake of Sugar-Sweetened and Low-Calorie Sweetened Beverages and Risk of Cardiovascular Disease: A Meta-Analysis and Systematic Review. Adv Nutr2021;12:89-101. doi:10.1093/advances/nmaa084 pmid:32696948CrossRefPubMedGoogle Scholar
↵Huang C, Huang J, Tian Y, Yang X, Gu D. Sugar sweetened beverages consumption and risk of coronary heart disease: a meta-analysis of prospective studies. Atherosclerosis2014;234:11-6. doi:10.1016/j.atherosclerosis.2014.01.037 pmid:24583500CrossRefPubMedWeb of ScienceGoogle Scholar
↵Bechthold A, Boeing H, Schwedhelm C, et al. Food groups and risk of coronary heart disease, stroke and heart failure: A systematic review and dose-response meta-analysis of prospective studies. Crit Rev Food Sci Nutr2019;59:1071-90. doi:10.1080/10408398.2017.1392288 pmid:29039970CrossRefPubMedGoogle Scholar
↵Ebrahimpour-Koujan S, Saneei P, Larijani B, Esmaillzadeh A. Consumption of sugar sweetened beverages and dietary fructose in relation to risk of gout and hyperuricemia: a systematic review and meta-analysis. Crit Rev Food Sci Nutr2020;60:1-10. doi:10.1080/10408398.2018.1503155 pmid:30277800CrossRefPubMedGoogle Scholar
↵Lee Y, Song GG. Association between Sugar-Sweetened Beverage Consumption and the Risk of Gout: A Meta-Analysis. J Rheum Dis2016;23:304-10doi:10.4078/jrd.2016.23.5.304.CrossRefGoogle Scholar
↵Ayoub-Charette S, Liu Q, Khan TA, et al. Important food sources of fructose-containing sugars and incident gout: a systematic review and meta-analysis of prospective cohort studies. BMJ Open2019;9:e024171. doi:10.1136/bmjopen-2018-024171 pmid:31061018Abstract/FREE Full TextGoogle Scholar
↵Wijarnpreecha K, Thongprayoon C, Edmonds PJ, Cheungpasitporn W. Associations of sugar- and artificially sweetened soda with nonalcoholic fatty liver disease: a systematic review and meta-analysis. QJM2016;109:461-6. doi:10.1093/qjmed/hcv172 pmid:26385233CrossRefPubMedGoogle Scholar
↵Asgari-Taee F, Zerafati-Shoae N, Dehghani M, Sadeghi M, Baradaran HR, Jazayeri S. Association of sugar sweetened beverages consumption with non-alcoholic fatty liver disease: a systematic review and meta-analysis. Eur J Nutr2019;58:1759-69. doi:10.1007/s00394-018-1711-4 pmid:29761318CrossRefPubMedGoogle Scholar
↵Chen H, Wang J, Li Z, et al. Consumption of sugar-sweetened beverages has a dose-dependent effect on the risk of non-alcoholic fatty liver disease: An updated systematic review and dose-response meta-analysis. Int J Environ Res Public Health2019;16:2192. doi:10.3390/ijerph16122192 pmid:31234281CrossRefPubMedGoogle Scholar
↵Valenzuela MJ, Waterhouse B, Aggarwal VR, Bloor K, Doran T. Effect of sugar-sweetened beverages on oral health: a systematic review and meta-analysis. Eur J Public Health2021;31:122-9. doi:10.1093/eurpub/ckaa147 pmid:32830237CrossRefPubMedGoogle Scholar
↵Li Y, Guo L, He K, Huang C, Tang S. Consumption of sugar-sweetened beverages and fruit juice and human cancer: a systematic review and dose-response meta-analysis of observational studies. J Cancer2021;12:3077-88. doi:10.7150/jca.51322 pmid:33854607CrossRefPubMedGoogle Scholar
↵Llaha F, Gil-Lespinard M, Unal P, de Villasante I, Castañeda J, Zamora-Ros R. Consumption of Sweet Beverages and Cancer Risk. A Systematic Review and Meta-Analysis of Observational Studies. Nutrients2021;13:516. doi:10.3390/nu13020516 pmid:33557387CrossRefPubMedGoogle Scholar
↵Hur J, Otegbeye E, Joh HK, et al. Sugar-sweetened beverage intake in adulthood and adolescence and risk of early-onset colorectal cancer among women. Gut2021;70:2330-6. doi:10.1136/gutjnl-2020-323450 pmid:33958435Abstract/FREE Full TextGoogle Scholar
↵Chazelas E, Srour B, Desmetz E, et al. Sugary drink consumption and risk of cancer: results from NutriNet-Santé prospective cohort. BMJ2019;366:l2408. doi:10.1136/bmj.l2408 pmid:31292122Abstract/FREE Full TextGoogle Scholar
↵Mann J, Cummings JH, Englyst HN, et al. FAO/WHO scientific update on carbohydrates in human nutrition: conclusions. Eur J Clin Nutr2007;61(Suppl 1):S132-7. doi:10.1038/sj.ejcn.1602943 pmid:17992184CrossRefPubMedWeb of ScienceGoogle Scholar
↵Phillips JA. Dietary Guidelines for Americans, 2020-2025. Workplace Health Saf2021;69:395. doi:10.1177/21650799211026980 pmid:34279148CrossRefPubMedGoogle Scholar
↵Malik VS, Schulze MB, Hu FB. Intake of sugar-sweetened beverages and weight gain: a systematic review. Am J Clin Nutr2006;84:274-88. doi:10.1093/ajcn/84.2.274 pmid:16895873Abstract/FREE Full TextGoogle Scholar
↵Rosinger A, Herrick K, Gahche J, Park S. Sugar-sweetened Beverage Consumption Among U.S. Youth, 2011-2014. NCHS Data Brief2017;(271):1-8.pmid:28135184Google Scholar
↵Blecher E, Liber AC, Drope JM, Nguyen B, Stoklosa M. Global Trends in the Affordability of Sugar-Sweetened Beverages, 1990-2016. Prev Chronic Dis2017;14:E37. doi:10.5888/pcd14.160406 pmid:28472607CrossRefPubMedGoogle Scholar
↵Malik VS, Hu FB. The role of sugar-sweetened beverages in the global epidemics of obesity and chronic diseases. Nat Rev Endocrinol2022;18:205-18. doi:10.1038/s41574-021-00627-6 pmid:35064240CrossRefPubMedGoogle Scholar
↵Welsh JA, Sharma AJ, Grellinger L, Vos MB. Consumption of added sugars is decreasing in the United States. Am J Clin Nutr2011;94:726-34. doi:10.3945/ajcn.111.018366 pmid:21753067Abstract/FREE Full TextGoogle Scholar
↵Malik VS, Willett WC, Hu FB. Global obesity: trends, risk factors and policy implications. Nat Rev Endocrinol2013;9:13-27. doi:10.1038/nrendo.2012.199 pmid:23165161CrossRefPubMedGoogle Scholar
↵El-Malky AM, Naik RG, Elnouman AA. Sugary beverages consumption and latent autoimmune diabetes in adults: Systematic review and meta-analysis. Clin Diabetol2020;9:118-27doi:10.5603/DK.2020.0007.CrossRefGoogle Scholar
↵Qin Z, Xu F, Ye Q, et al. Sugar-sweetened beverages and school students’ hypertension in urban areas of Nanjing, China. J Hum Hypertens2018;32:392-6. doi:10.1038/s41371-018-0030-9 pmid:29410454CrossRefPubMedGoogle Scholar
↵Kit BK, Fakhouri TH, Park S, Nielsen SJ, Ogden CL. Trends in sugar-sweetened beverage consumption among youth and adults in the United States: 1999-2010. Am J Clin Nutr2013;98:180-8. doi:10.3945/ajcn.112.057943 pmid:23676424Abstract/FREE Full TextGoogle Scholar
↵Singh GM, Micha R, Khatibzadeh S, et al., Global Burden of Diseases Nutrition and Chronic Diseases Expert Group (NutriCoDE). Global, Regional, and National Consumption of Sugar-Sweetened Beverages, Fruit Juices, and Milk: A Systematic Assessment of Beverage Intake in 187 Countries. PLoS One2015;10:e0124845. doi:10.1371/journal.pone.0124845 pmid:26244332CrossRefPubMedGoogle Scholar
↵Colchero MA, Popkin BM, Rivera JA, Ng SW. Beverage purchases from stores in Mexico under the excise tax on sugar sweetened beverages: observational study. BMJ2016;352:h6704. doi:10.1136/bmj.h6704 pmid:26738745Abstract/FREE Full TextGoogle Scholar
↵Taillie LS, Reyes M, Colchero MA, Popkin B, Corvalán C. An evaluation of Chile’s Law of Food Labeling and Advertising on sugar-sweetened beverage purchases from 2015 to 2017: A before-and-after study. PLoS Med2020;17:e1003015. doi:10.1371/journal.pmed.1003015 pmid:32045424CrossRefPubMedGoogle Scholar
↵Basu S, Vellakkal S, Agrawal S, Stuckler D, Popkin B, Ebrahim S. Averting obesity and type 2 diabetes in India through sugar-sweetened beverage taxation: an economic-epidemiologic modeling study. PLoS Med2014;11:e1001582. doi:10.1371/journal.pmed.1001582 pmid:24409102CrossRefPubMedGoogle Scholar
↵Manyema M, Veerman LJ, Chola L, et al. The potential impact of a 20% tax on sugar-sweetened beverages on obesity in South African adults: a mathematical model. PLoS One2014;9:e105287. doi:10.1371/journal.pone.0105287 pmid:25136987CrossRefPubMedGoogle Scholar
↵World Health Organization. Guideline: Sugars Intake for Adults and Children.World Health Organization, 2015.Google Scholar
↵Aromataris E, Fernandez R, Godfrey CM, Holly C, Khalil H, Tungpunkom P. Summarizing systematic reviews: methodological development, conduct and reporting of an umbrella review approach. Int J Evid Based Healthc2015;13:132-40. doi:10.1097/XEB.0000000000000055 pmid:26360830CrossRefPubMedGoogle Scholar
↵Papatheodorou S. Umbrella reviews: what they are and why we need them. Eur J Epidemiol2019;34:543-6. doi:10.1007/s10654-019-00505-6 pmid:30852716CrossRefPubMedGoogle Scholar
↵Scottish Intercollegiate Guidelines Network. Search Filters. https://www.sign.ac.uk/what-we-do/methodology/search-filters/.
↵Poole R, Kennedy OJ, Roderick P, Fallowfield JA, Hayes PC, Parkes J. Coffee consumption and health: umbrella review of meta-analyses of multiple health outcomes. BMJ2017;359:j5024. doi:10.1136/bmj.j5024 pmid:29167102Abstract/FREE Full TextGoogle Scholar
↵Huang Y, Cao D, Chen Z, et al. Iron intake and multiple health outcomes: Umbrella review. Crit Rev Food Sci Nutr2021;1-18. doi:10.1080/10408398.2021.1982861 pmid:34583608CrossRefPubMedGoogle Scholar
↵Shea BJ, Grimshaw JM, Wells GA, et al. Development of AMSTAR: a measurement tool to assess the methodological quality of systematic reviews. BMC Med Res Methodol2007;7:10. doi:10.1186/1471-2288-7-10 pmid:17302989CrossRefPubMedGoogle Scholar
↵Guyatt G, Oxman AD, Akl EA, et al. GRADE guidelines: 1. Introduction-GRADE evidence profiles and summary of findings tables. J Clin Epidemiol2011;64:383-94. doi:10.1016/j.jclinepi.2010.04.026 pmid:21195583CrossRefPubMedGoogle Scholar
↵Ioannidis JP. Integration of evidence from multiple meta-analyses: a primer on umbrella reviews, treatment networks and multiple treatments meta-analyses. CMAJ2009;181:488-93. doi:10.1503/cmaj.081086 pmid:19654195FREE Full TextGoogle Scholar
↵Veronese N, Solmi M, Caruso MG, et al. Dietary fiber and health outcomes: an umbrella review of systematic reviews and meta-analyses. Am J Clin Nutr2018;107:436-44. doi:10.1093/ajcn/nqx082 pmid:29566200CrossRefPubMedGoogle Scholar
↵Wallace TC, Bailey RL, Blumberg JB, et al. Fruits, vegetables, and health: A comprehensive narrative, umbrella review of the science and recommendations for enhanced public policy to improve intake. Crit Rev Food Sci Nutr2020;60:2174-211. doi:10.1080/10408398.2019.1632258 pmid:31267783CrossRefPubMedGoogle Scholar
↵Theodoratou E, Tzoulaki I, Zgaga L, Ioannidis JP. Vitamin D and multiple health outcomes: umbrella review of systematic reviews and meta-analyses of observational studies and randomised trials. BMJ2014;348:g2035. doi:10.1136/bmj.g2035 pmid:24690624Abstract/FREE Full TextGoogle Scholar
↵Huang Y, Cao D, Chen Z, et al. Red and processed meat consumption and cancer outcomes: Umbrella review. Food Chem2021;356:129697. doi:10.1016/j.foodchem.2021.129697 pmid:33838606CrossRefPubMedGoogle Scholar
↵Egger M, Davey Smith G, Schneider M, Minder C. Bias in meta-analysis detected by a simple, graphical test. BMJ1997;315:629-34. doi:10.1136/bmj.315.7109.629 pmid:9310563Abstract/FREE Full TextGoogle Scholar
↵Landis JR, Koch GG. The measurement of observer agreement for categorical data. Biometrics1977;33:159-74. doi:10.2307/2529310 pmid:843571CrossRefPubMedWeb of ScienceGoogle Scholar
↵Malik VS, Pan A, Willett WC, Hu FB. Sugar-sweetened beverages and weight gain in children and adults: a systematic review and meta-analysis. Am J Clin Nutr2013;98:1084-102. doi:10.3945/ajcn.113.058362 pmid:23966427Abstract/FREE Full TextGoogle Scholar
↵Ma J, Karlsen MC, Chung M, et al. Potential link between excess added sugar intake and ectopic fat: a systematic review of randomized controlled trials. Nutr Rev2016;74:18-32. doi:10.1093/nutrit/nuv047 pmid:26518034CrossRefPubMedGoogle Scholar
↵Wang DD, Sievenpiper JL, de Souza RJ, et al. The effects of fructose intake on serum uric acid vary among controlled dietary trials. J Nutr2012;142:916-23. doi:10.3945/jn.111.151951 pmid:22457397Abstract/FREE Full TextGoogle Scholar
↵Sievenpiper JL, de Souza RJ, Mirrahimi A, et al. Effect of fructose on body weight in controlled feeding trials: a systematic review and meta-analysis. Ann Intern Med2012;156:291-304. doi:10.7326/0003-4819-156-4-201202210-00007 pmid:22351714CrossRefPubMedWeb of ScienceGoogle Scholar
↵Ebrahimpour-Koujan S, Saneei P, Larijani B, Esmaillzadeh A. Consumption of sugar-sweetened beverages and serum uric acid concentrations: a systematic review and meta-analysis. J Hum Nutr Diet2021;34:305-13. doi:10.1111/jhn.12796 pmid:32683776CrossRefPubMedGoogle Scholar
↵Jamnik J, Rehman S, Blanco Mejia S, et al. Fructose intake and risk of gout and hyperuricemia: a systematic review and meta-analysis of prospective cohort studies. BMJ Open2016;6:e013191. doi:10.1136/bmjopen-2016-013191 pmid:27697882Abstract/FREE Full TextGoogle Scholar
↵Li R, Yu K, Li C. Dietary factors and risk of gout and hyperuricemia: a meta-analysis and systematic review. Asia Pac J Clin Nutr2018;27:1344-56.pmid:30485934PubMedGoogle Scholar
↵Nikniaz L, Abbasalizad-Farhangi M, Vajdi M, Nikniaz Z. The association between Sugars Sweetened Beverages (SSBs) and lipid profile among children and youth: A systematic review and dose-response meta-analysis of cross-sectional studies. Pediatr Obes2021;16:e12782. doi:10.1111/ijpo.12782 pmid:33629539CrossRefPubMedGoogle Scholar
↵Semnani-Azad Z, Khan TA, Blanco Mejia S, et al. Association of Major Food Sources of Fructose-Containing Sugars With Incident Metabolic Syndrome: A Systematic Review and Meta-analysis. JAMA Netw Open2020;3:e209993. doi:10.1001/jamanetworkopen.2020.9993 pmid:32644139CrossRefPubMedGoogle Scholar
↵Tsilas CS, de Souza RJ, Mejia SB, et al. Relation of total sugars, fructose and sucrose with incident type 2 diabetes: a systematic review and meta-analysis of prospective cohort studies. CMAJ2017;189:E711-20. doi:10.1503/cmaj.160706 pmid:28536126Abstract/FREE Full TextGoogle Scholar
↵Mattes RD, Shikany JM, Kaiser KA, Allison DB. Nutritively sweetened beverage consumption and body weight: a systematic review and meta-analysis of randomized experiments. Obes Rev2011;12:346-65. doi:10.1111/j.1467-789X.2010.00755.x pmid:20524996CrossRefPubMedGoogle Scholar
↵Ardeshirlarijani E, Jalilpiran Y, Daneshzad E, Larijani B, Namazi N, Azadbakht L. Association between sugar-sweetened beverages and waist circumference in adult populations: A meta-analysis of prospective cohort studies. Clin Nutr ESPEN2021;41:118-25. doi:10.1016/j.clnesp.2020.10.014 pmid:33487253CrossRefPubMedGoogle Scholar
↵David Wang D, Sievenpiper JL, de Souza RJ, et al. Effect of fructose on postprandial triglycerides: a systematic review and meta-analysis of controlled feeding trials. Atherosclerosis2014;232:125-33. doi:10.1016/j.atherosclerosis.2013.10.019 pmid:24401226CrossRefPubMedGoogle Scholar
↵Narain A, Kwok CS, Mamas MA. Soft drinks and sweetened beverages and the risk of cardiovascular disease and mortality: a systematic review and meta-analysis. Int J Clin Pract2016;70:791-805. doi:10.1111/ijcp.12841 pmid:27456347CrossRefPubMedGoogle Scholar
↵Jayalath VH, Sievenpiper JL, de Souza RJ, et al. Total fructose intake and risk of hypertension: a systematic review and meta-analysis of prospective cohorts. J Am Coll Nutr2014;33:328-39. doi:10.1080/07315724.2014.916237 pmid:25144126CrossRefPubMedGoogle Scholar
↵Zhang YB, Jiang YW, Chen JX, Xia PF, Pan A. Association of Consumption of Sugar-Sweetened Beverages or Artificially Sweetened Beverages with Mortality: A Systematic Review and Dose-Response Meta-Analysis of Prospective Cohort Studies. Adv Nutr2021;12:374-83. doi:10.1093/advances/nmaa110 pmid:33786594CrossRefPubMedGoogle Scholar
↵Farhangi MA, Nikniaz L, Khodarahmi M. Sugar-sweetened beverages increases the risk of hypertension among children and adolescence: a systematic review and dose-response meta-analysis. J Transl Med2020;18:344. doi:10.1186/s12967-020-02511-9 pmid:32891165CrossRefPubMedGoogle Scholar
↵Liu Q, Ayoub-Charette S, Khan TA, et al. Important Food Sources of Fructose-Containing Sugars and Incident Hypertension: A Systematic Review and Dose-Response Meta-Analysis of Prospective Cohort Studies. J Am Heart Assoc2019;8:e010977. doi:10.1161/JAHA.118.010977 pmid:31826724CrossRefPubMedGoogle Scholar
↵Khan TA, Tayyiba M, Agarwal A, et al. Relation of Total Sugars, Sucrose, Fructose, and Added Sugars With the Risk of Cardiovascular Disease: A Systematic Review and Dose-Response Meta-analysis of Prospective Cohort Studies. Mayo Clin Proc2019;94:2399-414. doi:10.1016/j.mayocp.2019.05.034 pmid:31806098CrossRefPubMedGoogle Scholar
↵Aune D, Chan DSM, Vieira AR, et al. Dietary fructose, carbohydrates, glycemic indices and pancreatic cancer risk: a systematic review and meta-analysis of cohort studies. Ann Oncol2012;23:2536-46. doi:10.1093/annonc/mds076 pmid:22539563CrossRefPubMedWeb of ScienceGoogle Scholar
↵Zhang X, Albanes D, Beeson WL, et al. Risk of colon cancer and coffee, tea, and sugar-sweetened soft drink intake: pooled analysis of prospective cohort studies. J Natl Cancer Inst2010;102:771-83. doi:10.1093/jnci/djq107 pmid:20453203CrossRefPubMedWeb of ScienceGoogle Scholar
↵Galeone C, Pelucchi C, La Vecchia C. Added sugar, glycemic index and load in colon cancer risk. Curr Opin Clin Nutr Metab Care2012;15:368-73. doi:10.1097/MCO.0b013e3283539f81 pmid:22510682CrossRefPubMedGoogle Scholar
↵Liu J, Tang W, Sang L, et al. Milk, yogurt, and lactose intake and ovarian cancer risk: a meta-analysis. Nutr Cancer2015;67:68-72. doi:10.1080/01635581.2014.956247 pmid:25298278CrossRefPubMedGoogle Scholar
↵Pan B, Ge L, Lai H, et al. Association of soft drink and 100% fruit juice consumption with all-cause mortality, cardiovascular diseases mortality, and cancer mortality: A systematic review and dose-response meta-analysis of prospective cohort studies. Crit Rev Food Sci Nutr2022;62:8908-19. doi:10.1080/10408398.2021.1937040 pmid:34121531CrossRefPubMedGoogle Scholar
↵Hu D, Cheng L, Jiang W. Sugar-sweetened beverages consumption and the risk of depression: A meta-analysis of observational studies. J Affect Disord2019;245:348-55. doi:10.1016/j.jad.2018.11.015 pmid:30419536CrossRefPubMedGoogle Scholar
↵Chiu S, Sievenpiper JL, de Souza RJ, et al. Effect of fructose on markers of non-alcoholic fatty liver disease (NAFLD): a systematic review and meta-analysis of controlled feeding trials. Eur J Clin Nutr2014;68:416-23. doi:10.1038/ejcn.2014.8 pmid:24569542CrossRefPubMedGoogle Scholar
↵Al-Zalabani AH, Noor Elahi I, Katib A, et al. Association between soft drinks consumption and asthma: a systematic review and meta-analysis. BMJ Open2019;9:e029046. doi:10.1136/bmjopen-2019-029046 pmid:31615794Abstract/FREE Full TextGoogle Scholar
↵Farsad-Naeimi A, Asjodi F, Omidian M, et al. Sugar consumption, sugar sweetened beverages and Attention Deficit Hyperactivity Disorder: A systematic review and meta-analysis. Complement Ther Med2020;53:102512. doi:10.1016/j.ctim.2020.102512 pmid:33066852CrossRefPubMedGoogle Scholar
↵Ahn H, Park YK. Sugar-sweetened beverage consumption and bone health: a systematic review and meta-analysis. Nutr J2021;20:41. doi:10.1186/s12937-021-00698-1 pmid:33952276CrossRefPubMedGoogle Scholar
↵Lo WC, Ou SH, Chou CL, Chen JS, Wu MY, Wu MS. Sugar- and artificially-sweetened beverages and the risks of chronic kidney disease: a systematic review and dose-response meta-analysis. J Nephrol2021;34:1791-804. doi:10.1007/s40620-020-00957-0 pmid:33502726CrossRefPubMedGoogle Scholar
↵Gupta A, Singh A, Fernando RL, Dharmage SC, Lodge CJ, Waidyatillake NT. The association between sugar intake during pregnancy and allergies in offspring: a systematic review and a meta-analysis of cohort studies. Nutr Rev2022;80:904-18. doi:10.1093/nutrit/nuab052 pmid:34432049CrossRefPubMedGoogle Scholar
↵Brisbois TD, Marsden SL, Anderson GH, Sievenpiper JL. Estimated intakes and sources of total and added sugars in the Canadian diet. Nutrients2014;6:1899-912. doi:10.3390/nu6051899 pmid:24815507CrossRefPubMedGoogle Scholar
↵Marriott BP, Cole N, Lee E. National estimates of dietary fructose intake increased from 1977 to 2004 in the United States. J Nutr2009;139:1228S-35S. doi:10.3945/jn.108.098277 pmid:19403716Abstract/FREE Full TextGoogle Scholar
↵Bernstein JT, Lou W, L’Abbe MR. Examining the Relationship between Free Sugars and Calorie Contents in Canadian Prepacked Foods and Beverages. Foods2017;6:75. doi:10.3390/foods6090075 pmid:28872586CrossRefPubMedGoogle Scholar
↵Aune D, Norat T, Romundstad P, Vatten LJ. Dairy products and the risk of type 2 diabetes: a systematic review and dose-response meta-analysis of cohort studies. Am J Clin Nutr2013;98:1066-83. doi:10.3945/ajcn.113.059030 pmid:23945722Abstract/FREE Full TextGoogle Scholar
↵Aune D, Norat T, Romundstad P, Vatten LJ. Whole grain and refined grain consumption and the risk of type 2 diabetes: a systematic review and dose-response meta-analysis of cohort studies. Eur J Epidemiol2013;28:845-58. doi:10.1007/s10654-013-9852-5 pmid:24158434CrossRefPubMedGoogle Scholar
↵Li M, Fan Y, Zhang X, Hou W, Tang Z. Fruit and vegetable intake and risk of type 2 diabetes mellitus: meta-analysis of prospective cohort studies. BMJ Open2014;4:e005497. doi:10.1136/bmjopen-2014-005497 pmid:25377009Abstract/FREE Full TextGoogle Scholar
↵Zhan J, Liu YJ, Cai LB, Xu FR, Xie T, He QQ. Fruit and vegetable consumption and risk of cardiovascular disease: A meta-analysis of prospective cohort studies. Crit Rev Food Sci Nutr2017;57:1650-63. doi:10.1080/10408398.2015.1008980 pmid:26114864CrossRefPubMedGoogle Scholar
↵Aune D, Keum N, Giovannucci E, et al. Whole grain consumption and risk of cardiovascular disease, cancer, and all cause and cause specific mortality: systematic review and dose-response meta-analysis of prospective studies. BMJ2016;353:i2716. doi:10.1136/bmj.i2716 pmid:27301975Abstract/FREE Full TextGoogle Scholar
↵Alexander DD, Bylsma LC, Vargas AJ, et al. Dairy consumption and CVD: a systematic review and meta-analysis. Br J Nutr2016;115:737-50. doi:10.1017/S0007114515005000 pmid:26786887CrossRefPubMedGoogle Scholar
↵Janevski M, Ratnayake S, Siljanovski S, McGlynn MA, Cameron-Smith D, Lewandowski P. Fructose containing sugars modulate mRNA of lipogenic genes ACC and FAS and protein levels of transcription factors ChREBP and SREBP1c with no effect on body weight or liver fat. Food Funct2012;3:141-9. doi:10.1039/C1FO10111K pmid:22159273CrossRefPubMedGoogle Scholar
↵Kim MS, Krawczyk SA, Doridot L, et al. ChREBP regulates fructose-induced glucose production independently of insulin signaling. J Clin Invest2016;126:4372-86. doi:10.1172/JCI81993 pmid:27669460CrossRefPubMedGoogle Scholar
↵Koo HY, Wallig MA, Chung BH, Nara TY, Cho BH, Nakamura MT. Dietary fructose induces a wide range of genes with distinct shift in carbohydrate and lipid metabolism in fed and fasted rat liver. Biochim Biophys Acta2008;1782:341-8. doi:10.1016/j.bbadis.2008.02.007 pmid:18346472CrossRefPubMedGoogle Scholar
↵Zhao S, Jang C, Liu J, et al. Dietary fructose feeds hepatic lipogenesis via microbiota-derived acetate. Nature2020;579:586-91. doi:10.1038/s41586-020-2101-7 pmid:32214246CrossRefPubMedGoogle Scholar
↵Badin PM, Louche K, Mairal A, et al. Altered skeletal muscle lipase expression and activity contribute to insulin resistance in humans. Diabetes2011;60:1734-42. doi:10.2337/db10-1364 pmid:21498783Abstract/FREE Full TextGoogle Scholar
↵Kumashiro N, Erion DM, Zhang D, et al. Cellular mechanism of insulin resistance in nonalcoholic fatty liver disease. Proc Natl Acad Sci U S A2011;108:16381-5. doi:10.1073/pnas.1113359108 pmid:21930939Abstract/FREE Full TextGoogle Scholar
↵Petersen MC, Shulman GI. Roles of Diacylglycerols and Ceramides in Hepatic Insulin Resistance. Trends Pharmacol Sci2017;38:649-65. doi:10.1016/j.tips.2017.04.004 pmid:28551355CrossRefPubMedGoogle Scholar
↵Softic S, Meyer JG, Wang GX, et al. Dietary Sugars Alter Hepatic Fatty Acid Oxidation via Transcriptional and Post-translational Modifications of Mitochondrial Proteins. Cell Metab2019;30:735-753.e4. doi:10.1016/j.cmet.2019.09.003 pmid:31577934CrossRefPubMedGoogle Scholar
↵Taylor SR, Ramsamooj S, Liang RJ, et al. Dietary fructose improves intestinal cell survival and nutrient absorption. Nature2021;597:263-7. doi:10.1038/s41586-021-03827-2 pmid:34408323CrossRefPubMedGoogle Scholar
↵Cox CL, Stanhope KL, Schwarz JM, et al. Consumption of fructose-sweetened beverages for 10 weeks reduces net fat oxidation and energy expenditure in overweight/obese men and women. Eur J Clin Nutr2012;66:201-8. doi:10.1038/ejcn.2011.159 pmid:21952692CrossRefPubMedWeb of ScienceGoogle Scholar
↵Sundborn G, Thornley S, Merriman TR, et al. Are Liquid Sugars Different from Solid Sugar in Their Ability to Cause Metabolic Syndrome?Obesity (Silver Spring)2019;27:879-87. doi:10.1002/oby.22472 pmid:31054268CrossRefPubMedGoogle Scholar
↵Malik VS. Sugar sweetened beverages and cardiometabolic health. Curr Opin Cardiol2017;32:572-9. doi:10.1097/HCO.0000000000000439 pmid:28639973CrossRefPubMedGoogle Scholar
↵DellaValle DM, Roe LS, Rolls BJ. Does the consumption of caloric and non-caloric beverages with a meal affect energy intake?Appetite2005;44:187-93. doi:10.1016/j.appet.2004.11.003 pmid:15808893CrossRefPubMedWeb of ScienceGoogle Scholar
↵Raben A, Vasilaras TH, Møller AC, Astrup A. Sucrose compared with artificial sweeteners: different effects on ad libitum food intake and body weight after 10 wk of supplementation in overweight subjects. Am J Clin Nutr2002;76:721-9. doi:10.1093/ajcn/76.4.721 pmid:12324283Abstract/FREE Full TextGoogle Scholar
↵Reid M, Hammersley R, Hill AJ, Skidmore P. Long-term dietary compensation for added sugar: effects of supplementary sucrose drinks over a 4-week period. Br J Nutr2007;97:193-203. doi:10.1017/S0007114507252705 pmid:17217576CrossRefPubMedGoogle Scholar
↵Geidl-Flueck B, Hochuli M, Németh Á, et al. Fructose- and sucrose- but not glucose-sweetened beverages promote hepatic de novo lipogenesis: A randomized controlled trial. J Hepatol2021;75:46-54. doi:10.1016/j.jhep.2021.02.027 pmid:33684506CrossRefPubMedGoogle Scholar
↵Choi HK, Curhan G. Soft drinks, fructose consumption, and the risk of gout in men: prospective cohort study. BMJ2008;336:309-12. doi:10.1136/bmj.39449.819271.BE pmid:18244959Abstract/FREE Full TextGoogle Scholar
↵Choi HK, Willett W, Curhan G. Fructose-rich beverages and risk of gout in women. JAMA2010;304:2270-8. doi:10.1001/jama.2010.1638 pmid:21068145CrossRefPubMedGoogle Scholar
↵Kanbay M, Jensen T, Solak Y, et al. Uric acid in metabolic syndrome: From an innocent bystander to a central player. Eur J Intern Med2016;29:3-8. doi:10.1016/j.ejim.2015.11.026 pmid:26703429CrossRefPubMedGoogle Scholar
↵Wu T, Giovannucci E, Pischon T, et al. Fructose, glycemic load, and quantity and quality of carbohydrate in relation to plasma C-peptide concentrations in US women. Am J Clin Nutr2004;80:1043-9. doi:10.1093/ajcn/80.4.1043 pmid:15447918Abstract/FREE Full TextGoogle Scholar
↵Quiñones Galvan A, Natali A, Baldi S, et al. Effect of insulin on uric acid excretion in humans. Am J Physiol1995;268:E1-5.pmid:7840165CrossRefPubMedWeb of ScienceGoogle Scholar
↵Richette P, Bardin T. Gout. Lancet2010;375:318-28. doi:10.1016/S0140-6736(09)60883-7 pmid:19692116CrossRefPubMedWeb of ScienceGoogle Scholar
↵Nakagawa T, Tuttle KR, Short RA, Johnson RJ. Hypothesis: fructose-induced hyperuricemia as a causal mechanism for the epidemic of the metabolic syndrome. Nat Clin Pract Nephrol2005;1:80-6. doi:10.1038/ncpneph0019 pmid:16932373CrossRefPubMedWeb of ScienceGoogle Scholar
↵Cicero AFG, Fogacci F, Desideri G, et al. Arterial Stiffness, Sugar-Sweetened Beverages and Fruits Intake in a Rural Population Sample: Data from the Brisighella Heart Study. Nutrients2019;11:2674. doi:10.3390/nu11112674 pmid:31694231CrossRefPubMedGoogle Scholar
↵Caliceti C, Calabria D, Roda A, Cicero AFG. Fructose Intake, Serum Uric Acid, and Cardiometabolic Disorders: A Critical Review. Nutrients2017;9:395. doi:10.3390/nu9040395 pmid:28420204CrossRefPubMedGoogle Scholar
↵Johnson RJ, Sanchez-Lozada LG, Nakagawa T. The effect of fructose on renal biology and disease. J Am Soc Nephrol2010;21:2036-9. doi:10.1681/ASN.2010050506 pmid:21115612Abstract/FREE Full TextGoogle Scholar
↵World Cancer Research Fund International. Diet, nutrition, physical activity and cancer: A global perspective. A summary of the Third Expert Report. 2018. https://www.wcrf.org/dietandcancer/a-summary-of-the-third-expert-report/.
↵Augustin LSA, Kendall CWC, Jenkins DJA, et al. Glycemic index, glycemic load and glycemic response: An International Scientific Consensus Summit from the International Carbohydrate Quality Consortium (ICQC). Nutr Metab Cardiovasc Dis2015;25:795-815. doi:10.1016/j.numecd.2015.05.005 pmid:26160327CrossRefPubMedGoogle Scholar
↵Avgerinos KI, Spyrou N, Mantzoros CS, Dalamaga M. Obesity and cancer risk: Emerging biological mechanisms and perspectives. Metabolism2019;92:121-35. doi:10.1016/j.metabol.2018.11.001 pmid:30445141CrossRefPubMedGoogle Scholar
↵Todoric J, Di Caro G, Reibe S, et al. Fructose stimulated de novo lipogenesis is promoted by inflammation. Nat Metab2020;2:1034-45. doi:10.1038/s42255-020-0261-2 pmid:32839596CrossRefPubMedGoogle Scholar
↵Do MH, Lee E, Oh MJ, Kim Y, Park HY. High-Glucose or -Fructose Diet Cause Changes of the Gut Microbiota and Metabolic Disorders in Mice without Body Weight Change. Nutrients2018;10:761. doi:10.3390/nu10060761 pmid:29899272CrossRefPubMedGoogle Scholar
↵Goncalves MD, Lu C, Tutnauer J, et al. High-fructose corn syrup enhances intestinal tumor growth in mice. Science2019;363:1345-9. doi:10.1126/science.aat8515 pmid:30898933Abstract/FREE Full TextGoogle Scholar
↵Harrell CS, Burgado J, Kelly SD, Johnson ZP, Neigh GN. High-fructose diet during periadolescent development increases depressive-like behavior and remodels the hypothalamic transcriptome in male rats. Psychoneuroendocrinology2015;62:252-64. doi:10.1016/j.psyneuen.2015.08.025 pmid:26356038CrossRefPubMedGoogle Scholar
↵Avena NM, Rada P, Hoebel BG. Evidence for sugar addiction: behavioral and neurochemical effects of intermittent, excessive sugar intake. Neurosci Biobehav Rev2008;32:20-39. doi:10.1016/j.neubiorev.2007.04.019 pmid:17617461CrossRefPubMedWeb of ScienceGoogle Scholar
↵Tucker KL. Dietary intake and bone status with aging. Curr Pharm Des2003;9:2687-704. doi:10.2174/1381612033453613 pmid:14529541CrossRefPubMedGoogle Scholar
↵Alswat KA. Gender Disparities in Osteoporosis. J Clin Med Res2017;9:382-7. doi:10.14740/jocmr2970w pmid:28392857CrossRefPubMedGoogle Scholar
↵Lustig RH, Schmidt LA, Brindis CD. Public health: The toxic truth about sugar. Nature2012;482:27-9. doi:10.1038/482027a pmid:22297952CrossRefPubMedWeb of ScienceGoogle Scholar
↵Tahmassebi JF, Duggal MS, Malik-Kotru G, Curzon ME. Soft drinks and dental health: a review of the current literature. J Dent2006;34:2-11. doi:10.1016/j.jdent.2004.11.006 pmid:16157439CrossRefPubMedGoogle Scholar
↵Moynihan PJ, Kelly SA. Effect on caries of restricting sugars intake: systematic review to inform WHO guidelines. J Dent Res2014;93:8-18. doi:10.1177/0022034513508954 pmid:24323509CrossRefPubMedGoogle Scholar
↵Touger-Decker R, Sirois DA, Mobley CCKouba J. Impact of Environment, Ethnicity, and Culture on Nutrition and Health. In: Touger-Decker R, Sirois DA, Mobley CC, eds. Nutrition and Oral Medicine. Humana Press, 2005:45-60 doi:10.1385/1-59259-831-5:045.CrossRefGoogle Scholar
↵Pestoni G, Krieger JP, Sych JM, Faeh D, Rohrmann S. Cultural Differences in Diet and Determinants of Diet Quality in Switzerland: Results from the National Nutrition Survey menuCH. Nutrients2019;11:126. doi:10.3390/nu11010126 pmid:30634520CrossRefPubMedGoogle Scholar
↵Dhingra R, Sullivan L, Jacques PF, et al. Soft drink consumption and risk of developing cardiometabolic risk factors and the metabolic syndrome in middle-aged adults in the community. Circulation2007;116:480-8. doi:10.1161/CIRCULATIONAHA.107.689935 pmid:17646581Abstract/FREE Full TextGoogle Scholar
↵Gardener H, Rundek T, Markert M, Wright CB, Elkind MS, Sacco RL. Diet soft drink consumption is associated with an increased risk of vascular events in the Northern Manhattan Study. J Gen Intern Med2012;27:1120-6. doi:10.1007/s11606-011-1968-2 pmid:22282311CrossRefPubMedGoogle Scholar
↵Eshak ES, Iso H, Kokubo Y, et al. Soft drink intake in relation to incident ischemic heart disease, stroke, and stroke subtypes in Japanese men and women: the Japan Public Health Centre-based study cohort I. Am J Clin Nutr2012;96:1390-7. doi:10.3945/ajcn.112.037903 pmid:23076619Abstract/FREE Full TextGoogle Scholar
↵Fung TT, Malik V, Rexrode KM, Manson JE, Willett WC, Hu FB. Sweetened beverage consumption and risk of coronary heart disease in women. Am J Clin Nutr2009;89:1037-42. doi:10.3945/ajcn.2008.27140 pmid:19211821Abstract/FREE Full TextGoogle Scholar
↵Pereira MA, Kartashov AI, Ebbeling CB, et al. Fast-food habits, weight gain, and insulin resistance (the CARDIA study): 15-year prospective analysis. Lancet2005;365:36-42. doi:10.1016/S0140-6736(04)17663-0 pmid:15639678CrossRefPubMedWeb of ScienceGoogle Scholar
↵Jaeschke R, Guyatt GH, Dellinger P, et al., GRADE Working Group. Use of GRADE grid to reach decisions on clinical practice guidelines when consensus is elusive. BMJ2008;337:a744. doi:10.1136/bmj.a744 pmid:18669566CrossRefPubMedGoogle Scholar
↵IARC Working Group on the Evaluation of Carcinogenic Risks to Humans. Some chemicals present in industrial and consumer products, food and drinking-water. IARC Monogr Eval Carcinog Risks Hum2013;101:9-549.pmid:24772663PubMedGoogle Scholar
↵Smith TJ, Wolfson JA, Jiao D, et al. Caramel color in soft drinks and exposure to 4-methylimidazole: a quantitative risk assessment. PLoS One2015;10:e0118138. doi:10.1371/journal.pone.0118138 pmid:25693062CrossRefPubMedGoogle Scholar
↵Nardin T, Barnaba C, Abballe F, Trenti G, Malacarne M, Larcher R. Fast analysis of quaternary ammonium pesticides in food and beverages using cation-exchange chromatography coupled with isotope-dilution high-resolution mass spectrometry. J Sep Sci2017;40:3928-37. doi:10.1002/jssc.201700579 pmid:28779575CrossRefPubMedGoogle Scholar
↵Albero B, Sánchez-Brunete C, Tadeo JL. Determination of organophosphorus pesticides in fruit juices by matrix solid-phase dispersion and gas chromatography. J Agric Food Chem2003;51:6915-21. doi:10.1021/jf030414m pmid:14611147CrossRefPubMedGoogle Scholar
↵Additives E. Scientific Opinion on the re‐evaluation of aspartame (E 951) as a food additive. EFSA J2013;11:3495.Google Scholar
↵Jayalath VH, de Souza RJ, Ha V, et al. Sugar-sweetened beverage consumption and incident hypertension: a systematic review and meta-analysis of prospective cohorts. Am J Clin Nutr2015;102:914-21. doi:10.3945/ajcn.115.107243 pmid:26269365Abstract/FREE Full TextGoogle Scholar
↵Joh HK, Lee DH, Hur J, et al. Simple Sugar and Sugar-Sweetened Beverage Intake During Adolescence and Risk of Colorectal Cancer Precursors. Gastroenterology2021;161:128-142.e20. doi:10.1053/j.gastro.2021.03.028 pmid:33753105CrossRefPubMedGoogle Scholar
↵Malik VS, Li Y, Pan A, et al. Long-Term Consumption of Sugar-Sweetened and Artificially Sweetened Beverages and Risk of Mortality in US Adults. Circulation2019;139:2113-25. doi:10.1161/CIRCULATIONAHA.118.037401 pmid:30882235CrossRefPubMedGoogle Scholar
↵Gao M, Jebb SA, Aveyard P, et al. Associations Between Dietary Patterns and Incident Type 2 Diabetes: Prospective Cohort Study of 120,343 UK Biobank Participants. Diabetes Care2022;45:1315-25. doi:10.2337/dc21-2258 pmid:35299247CrossRefPubMedGoogle Scholar